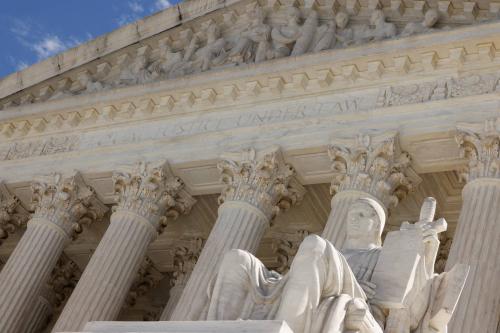
On Feb. 25, 2022, President Biden nominated Ketanji Brown Jackson as his nominee to fill the Supreme Court vacancy left by Justice Stephen Breyer’s retirement.
Any day now President Biden will announce his nominee to replace Justice Stephen Breyer. As we await the news, consider the significant changes that have occurred in the appointment process over the last 120 years, changes that speak in part to the changing role of the Court itself.
The chart below provides summary data on aspects of the process in four quarters, each containing seven or eight four-year presidential terms. It starts with the years from 1897-1901, from the administrations of President William McKinley through that of President Herbert Hoover. McKinley entered office after Congress, in 1891, relieved the Court’s workload by creating intermediate appellate courts, started to whittle down its obligatory jurisdiction, and ended the last vestiges of the justices’ duty to travel the country serving as trial judges.
In the eight four-year terms from McKinley through Hoover, presidents appointed 21 justices (a 95% confirmation rate), there were median days of nine from nomination to Senate vote (or nomination withdrawal), 64% of the votes were voice rather than recorded votes, and 22% of the recorded votes were nay votes. Furthermore, at time of appointment, 38% of the justices were sitting judges, their median age was 55, and they remained in active service on the court for median years of 15.
In the two most recent quarters, the process has become more contentious. Confirmation rates dropped into the mid 70 to 80 percent range—as the first column indicates. There was one rejection before 1933 (Hoover’s failed nomination of Judge John Parker) compared to two Johnson withdrawals (Fortas and Thornberry), two Nixon rejections (Haynsworth and Carswell), the Bork defeat, Bush’s withdrawal of Harriett Mier’s nomination, and the refusal to act on the Garland nomination.
Quick Senate confirmations were the norm in the first two periods as indicated in the second column of the chart. The Senate confirmed former President Taft to be chief justice on June 30,1921, the same day that Harding nominated him. (Of course, there were exceptions—witness the 125-day slog to confirm Louis Brandeis in 1916 in the face of virulent anti-Semitism and opposition from the white-shoe bar.) The percentage of perfunctory confirmations dropped from 67% to 17% in the third quarter, and median days from nomination to confirmation rose to 57. In the quarter starting in 1989, perfunctory confirmations became a thing of the past, and there were median days of 69 from nomination to floor vote. That is still faster than time to confirmation for lower court nominees. Median days to confirm Biden’s first-year circuit judges were 119 and, among recent predecessors, median days were all higher than 69 except Reagan’s 45—compared to Obama’s 229.
Also, the vocation recruitment pool for justices has changed as shown in the fifth column of the chart. Thirty-eight percent of the first quarter’s appointees came to the Court from the federal or state bench. That figure dropped for the second quarter, especially given Roosevelt’s nomination of attorneys general and other officials. The figure rose to 50% in the third period. Since H.W. Bush, only one Supreme Court justice did not come to the court from a federal appellate court (former Solicitor General Kagan).
The far left and right-hand columns tell an important story. Presidents are making fewer appointments because justices are serving longer. In the first quarter, presidents appointed 21 justices, who served a median of 15 years. In the most recent quarter, presidents appointed only 11 justices, but for justices appointed since 1961, the median years of service is well over 20—almost 30 for Ginsburg and Breyer. Thomas (not shown) has already served over 30 years, and similar ranges can be projected for the other sitting justices, especially because the median age at appointment has dropped from the mid-50s to 51 for the last period shown. Longer tenure, less turnover, fewer appointments.
This has implications for the need to put what Chief Justice Rehnquist called a “popular imprint” on the necessarily undemocratic judiciary. More frequent appointments serve that goal by keeping the Court roughly compatible with governing majorities, as explained here . (Even in the early period of more frequent appointments, the Court sometimes fell out of sync. FDR’s inability to replace any justices his first term led to the court-packing crisis.) Generally, though, more frequent turnover of justices (appointed by presidents and confirmed by senate majorities both of which represent popular majorities) helps keep the Court from straying too far from the mainstream.

Footnote
Data for this essay come from the Senate’s Supreme Court Nominations, the Federal Judicial Center’s Biographical Directory, and standard biographical sources.


Commentary
Changes in Supreme Court appointments—fewer justices, longer terms, more contentious confirmations
February 17, 2022