The usual explanations for the Democrats’ drubbing in this year’s mid-term elections have focused mainly on the lopsided number of Democrats up for reelection, especially in red states, low turnout among important parts of the Obama coalition, and the President’s depressed popularity. But there’s also one very basic and underlying issue that played an important part not only in this year’s GOP wave, but also in the Democratic landslides in 2006 and 2008, the last GOP wave in 2010, and the Democratic sweep in 2012. What has happened to the incomes of middle-class Americans?
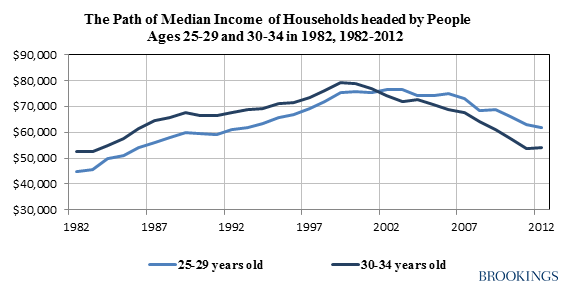
In a forthcoming report from Brookings, we will trace the income paths of several “age-cohorts” of Americans as they aged over the last 35 years. For a long time, the direction of that path was given: Average Americans could and did improve their economic lot simply by working hard, year after year. Certainly, that’s precisely what happened in the 1980s and 1990s. Using new Census Bureau data, we can now track the median income of age-cohorts as they grow older—for example, the incomes of those age 25 in 1980 when they turn 35 in 1990 and 45 in 2000. Those data tells us, for example, that the median real income of households headed by people ages 25-to-29 in 1982 rose from $44,785 in that year to $60,927 in 1992 and $76,427 in 2002—income gains 3.5 percent per-year, year after year for 20 years.
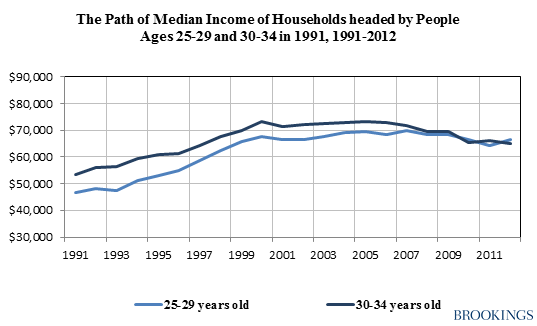
This has mattered in the last six elections, because, in recent years, those regular gains virtually stopped. For example, the median income of households headed by people ages 25-to-29 in 1991 rose from $48,098 in 1992 to $66,374 in 2002, for gains averaging 3.8 percent per-year; yet by 2012, their median income was still just $66,551, for annual gains averaging just three-tenths of one percent for a decade.
The graph below depicts the incomes paths of households headed by those ages 25-to-29 in 1982 (the light blue line) and those ages 30-to-34 in 1982 (the dark blue line) from 1982 to 2012. It clearly shows their incomes rising steadily through the 1980s and 1990s, until it simply stopped in 2000 or 2002.
Now, income gains usually slow sharply when people reach their mid-to-late forties and older. So let’s look at the income paths of households headed by people ages 25-to-29 in 1991 and people ages 30-to-34 in 1991. Again, we see their incomes rising sharply and steadily through the 1990s, and stalling out from 2000 or 2002 until the present.
By looking at the path of median income gains by the same age groups under each President, we also can draw some tentative conclusions about the relationships between these gains and political success. For example, take households headed by people ages 25-to-29 in the second year of each President’s term. The median household income of that age cohort increased at average rates of 4.0 percent per-year in the 1980s under Reagan and 5.3 percent per-year in the 1990s under Clinton—and then decelerated sharply to 1.9 percent per-year under Bush-2 and 2.6 percent per-year under Obama. The contrast is even greater with older households. The median incomes of households headed by people ages 35-to-39 in the second year of each President’s term grew at average annual rates of 2.8 percent under Reagan and 2.5 percent under Clinton, followed by gains of just 0.3 percent per-year under Bush-2 and actual losses of 0.1 percent per-year under Obama. (The Obama record here covers only 2010-2012, because the last available year of these income data by age covers 2012.)
We also constructed the income paths of age cohorts by the gender, race and ethnicity, and educational levels of their household heads. Income differences based on race and ethnicity have not changed much since the early 1980s—which tells us households headed by whites, blacks and Hispanics have made roughly comparable income progress for the last 35 years. In the case of gender, incomes grew much faster for female-headed households in the 1990s than male-headed households, but that dynamic was reversed for the last decade.
There is one finding that can well explain the unusual volatility and disaffection of so many American voters over the last decade. In 2000, 16 percent of households were headed by people without high school diplomas, and another 51 percent were headed by people without college degrees. From 2002 to 2012, the median income of the first group, across age cohorts, declined at an average annual rate of 2.4 percent, year after year; and the median income of the second group, across age cohorts fell at an average annual rate of 1 percent, year after year. That tells us that two-thirds of American households have suffered persistent income losses as they aged from 2002 to 2012, through eight years of economic expansion along with two years of serious recession. The median income of the remaining households, headed by college graduates, increased over this period—but at only one-third of the rate of households headed by college graduates in the 1980s and 1990s.
These trends have enormous electoral consequences. They explain why, in recent years, overall positive economic numbers and growth are not translating into feelings of shared prosperity. That’s why so many Americans are angry and ready to turn on whichever party has most recently failed to restore the broad income progress that almost everyone experienced in the 1980s and 1990s.


Commentary
The Economic Foundations of This Year’s Mid-Term Elections
November 18, 2014