As Congress considers the future of child-care policy in the U.S., subsidies for young children’s care and education are an important tool under consideration. Substantial evidence indicates that high-quality early care and education (ECE) experiences, facilitated through policies to expand and enhance program offerings, can support both parents’ employment and children’s development over the short and long term.[1]
Still, there is little specific quantitative evidence on how an influx of public money would impact families and the ECE sector. In response, we developed a model of supply and demand for ECE and use it to estimate the impact of expanded ECE subsidies similar to recent congressional proposals.
In a new paper, we model two policy scenarios that would increase federal funding for children ages 0 to 4 years old:
- a “narrow” expansion of child-care subsidies for all eligible households up to 85% of median income; and
- a “broad” program including households up to 250% of median income.
In both scenarios, household contributions (copays) start at zero for the poorest households, increase with income, and are capped at or below 7% of income up to the maximum income-eligibility threshold.[2] In both cases, parents must also satisfy an activity requirement to receive subsidies.
We explore a broad set of outcomes: (1) ECE participation by type of setting; (2) costs to households; (3) total costs of care; (4) mothers’ employment; and (5) ECE teacher wages.[3] The sections below describe our findings for each outcome. In each case, we compare the effects of the two scenarios to a baseline using the 2019 tax and child-care policy environment.[4]
Findings
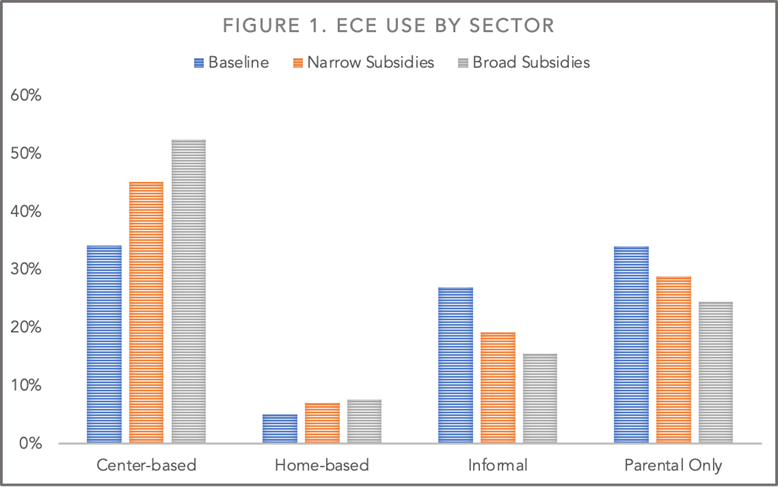
Expanded subsidies increase child-care utilization, with a shift to center-based care especially
Families use ECE services in a variety of settings: in a center (or school), a provider’s home, or the child’s home. We distinguish between these settings and assume that informal care, provided by relatives or in unlicensed homes, would not qualify for the expanded subsidies. Prior research finds that center-based care averages the highest level of quality among the different ECE settings, though there is quality variance within all setting types (and care in smaller-scale settings may be important for families valuing a particular cultural fit).
Under either policy scenario, we estimate a sharp increase in the use of center-based care programs eligible for the subsidy. This result is evident in Figure 1. Under the narrow expansion of child-care subsidies, we estimate that households would increase their use of center-based care by 11 percentage points. Under the broader expansion, they would increase center use by 18 percentage points, from 34% to 52%. Households increase use of care in providers’ homes, also eligible for subsidies, by 2-3 percentage points. Families offset these increases in formal care with declines in the use of informal care by family, friends, and neighbors, and in parental care.
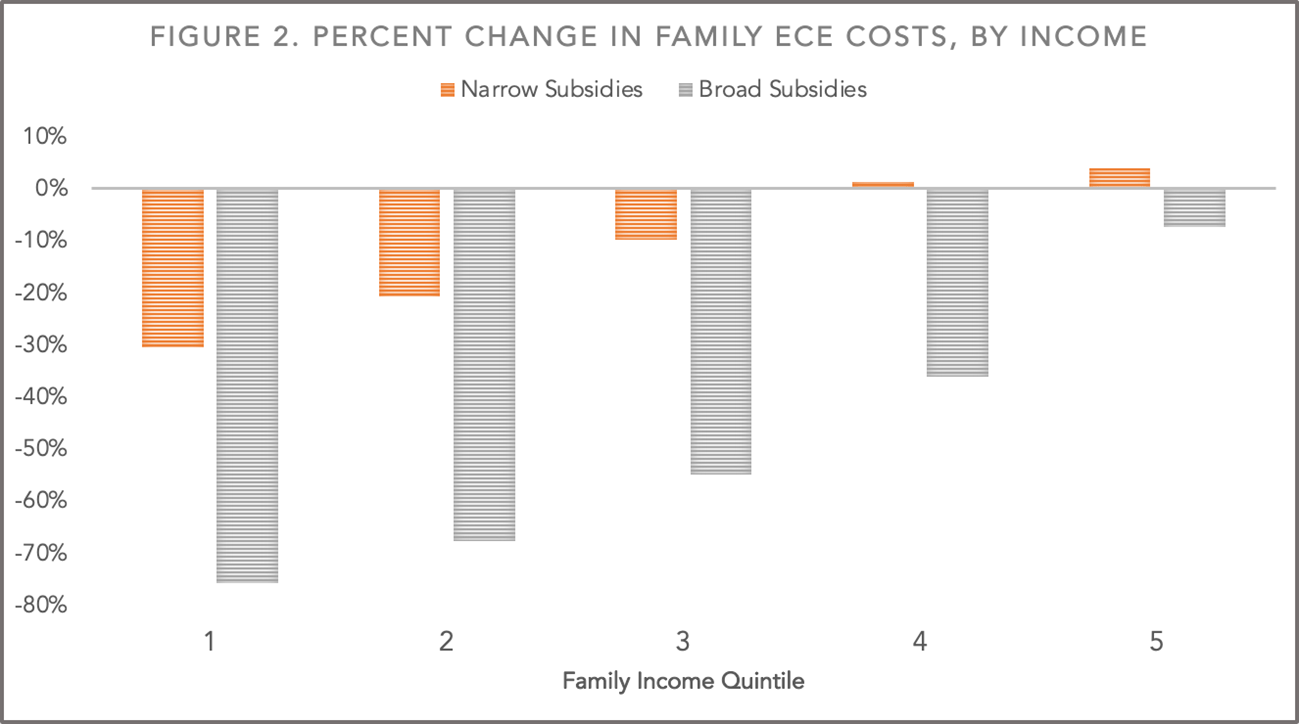
Child-care expenditures are reduced for most households despite modest increases in total costs of care
In the past 15 years, the cost per hour of child care paid by families has increased by nearly one-third (authors’ calculations based on the National Household Education Survey). A broad expansion of child-care subsidies would substantially reduce the costs that households pay on average for child care. For households using full-time ECE, average expenditures would decline from about $8,100 per year to approximately $5,000, which would be a decline from nearly 18% to 6% of (after-tax) income. Single-parent households would experience a 60% decline in ECE expenditures under the broad subsidy expansion. The reduction in household costs is more modest under the narrow subsidy expansion. Average household expenditures (for full-time care) would fall from approximately $8,100 (close to 18% of income) to $7,700 (12% of income). Many more households would see significant reductions in child-care costs under the broad than the narrow expansion of subsidies, as shown in Figure 2. Our results suggest that increases in total costs of care are more widely experienced under the narrow subsidy framework than under the broad design, an important result for those concerned about whether families face higher costs.
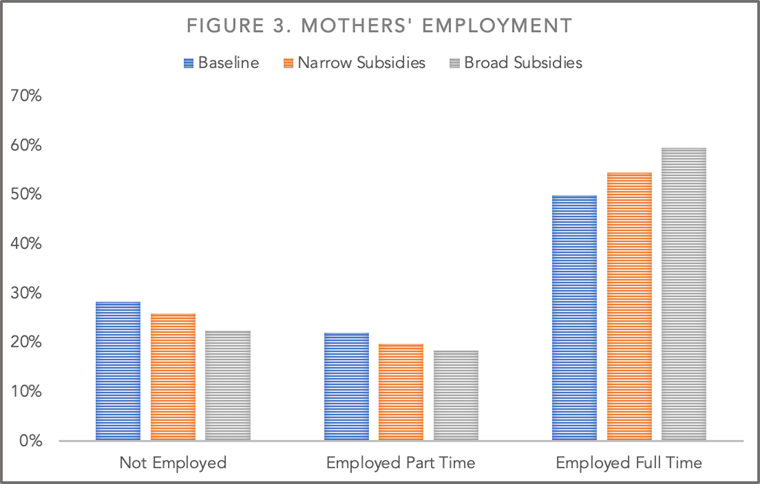
Expanded subsidies encourage more mothers to work
The model predicts significant increases in the proportion of mothers working as child care becomes more affordable under the expanded child-care subsidies. About half of all mothers with children under age 5 were working full time at baseline, and another 22% worked part time. Figure 3 shows employment shifts among mothers under the narrow and broad subsidy schemes. With the narrow expansion of child-care subsidies, mothers’ overall labor-force participation is predicted to increase by 2 percentage points and full-time participation is predicted to increase by almost 5 percentage points. The broad expansion of subsidies doubles the size of the increases, with about 1.2 million more mothers working full-time. More than three-quarters of mothers with young children would choose to work, either part time or full time, with broad subsidies.
Increased demand drives increased wages for ECE teachers
With expanded child-care subsidies, increased demand for child-care services leads to sizable increases in the ECE workforce and, consequently, compensation would have to rise to attract new people into the sector. To attract the teachers that families want and could now afford (including teachers with more formal education), providers would have to raise wages to attract people into the ECE sector. We estimate that ECE teachers’ wages would increase by almost 19% for teachers with at least a bachelor’s degree under a narrow expansion and 29% under a broad expansion. For teachers with less formal education, wages would rise by nearly 10% under the narrow expansion and 14% under the broad expansion. Existing evidence suggests higher ECE wages are associated with lower turnover and higher-quality care.[5]
Who Benefits the Most?
Lower-income families see the greatest reductions in cost burden, largest increases in employment, and largest improvements in care quality
Reductions in the child-care cost burden of families and increased participation in employment are concentrated among lower-income and lower-middle-income families based on the assumed progressive copay schedule and income-eligibility limits of the broad expansion of child-care subsidies. While reductions in family ECE costs are largest for low-income families, families across the income distribution experience lower costs under the broad policy. Middle-high-income and high-income families experience modest increases in ECE expenditures under the narrow plan. Full-time employment of mothers in the lowest two income quintiles would increase by 9-13 percentage points under the narrow expansion and 16-18 percentage points under the broad expansion of child-care subsidies. Employment of mothers in the highest income quintile would barely change with either subsidy expansion.
The expansion of child-care subsidies increases the access of lower-income families to formal ECE care, which tends to be higher quality. The largest shifts in child-care utilization occur in the lowest two income quintiles, although the broad expansion also shifts care types for middle-income families. In the poorest fifth of households, the narrow policy increases the use of center-based care by 30 percentage points and home-based care by 6 percentage points. These shifts are offset by declines in the use of informal and parent-only care. Higher up the income scale, the difference between narrow and broad policies become larger, as do the differences in their effects. For instance, for the middle-income fifth of households (3rd quintile), the narrow policy raises center use by nearly 7 percentage points while the broad policy raises center use by 18 percentage points.
Policy Tradeoffs
There is widespread recognition across the political spectrum of the importance of access to high-quality ECE. The various plans for expanding child-care subsidies differ primarily in the depth and breadth of the subsidies. A broad expansion of subsidies increasing the income-eligibility thresholds to 250% of median income (as in the Build Back Better Act) would substantially reduce families’ child-care cost burden. If policymakers decide on a maximum income-eligibility threshold that is lower, such as 85% of median income, the increase in affordability for families would be smaller and would lead to smaller increases in parental employment and use of formal care settings.
Expanded subsidies will increase the demand for formal care, leading to an increase in ECE teacher wages and modestly higher costs of providing ECE services. Much of the cost increase per child comes from shifting toward care settings with more teachers per child and teachers with more formal education, rather than from wage increases themselves. Most families would pay less due to the subsidies, although market prices for the highest-income families who do not qualify for the expanded subsidies would increase. These higher prices, which are more concentrated in the broad subsidy design and more widely experienced under the narrow subsidy design, could support improvements in the quality of care with higher wages, reduced turnover, and participation in quality-rating systems.
Conclusion
The COVID-19 pandemic highlighted and exacerbated many of the challenges in the ECE sector—especially the lack of supply, the high cost for families, and the low wages paid to ECE teachers. Fixing these problems is not possible without increased public investment in the ECE sector. Our analysis finds that a substantial reduction in the child-care cost burden for families will help close the income-related gap in access to ECE and support more working parents. Parents will respond to the increased availability of subsidies by working more and using more center- and provider-home-based care. And ECE providers will respond to the increased demand by expanding supply and increasing wages to draw more workers into the sector. These short-run changes have the potential for longer-run impacts on families’ economic well-being (through expansion of employment and wage growth) and on child development (through improved access to high quality ECE services).
With the rapid development of children’s brains between birth and age 5 as well as the known links between early childhood experiences and later life outcomes, expanded public funding to increase access to high-quality ECE is a good investment in current and future American productivity.
Footnotes
- For summaries of the evidence on ECE effectiveness, see Cascio (2021), Currie (2001), and Duncan and Magnuson (2013). (Back to top)
- The narrow policy is meant to capture in broad strokes the Child Care and Development Block Grant (CCDBG) eligibility criteria and copay structure with full funding for all eligible families, while the broader policy captures some of the key features of the Build Back Better Act’s child-care proposal. We do not model the effects of the universal pre-K portion of the Build Back Better Act. We also do not estimate the effects of proposed increased funding for facilities, which could help to increase the supply and quality of ECE services. (Back to top)
- Costs to families refers to the household’s out-of-pocket expenses on child care, net of any subsidization. Total costs of care are the full ECE provider costs, or the market prices of child care. While we refer to “ECE teachers,” we include all those working in ECE settings who provide care and education for children under age 5. (Back to top)
- The baseline scenario reflects the Earned Income Tax Credit, Child Tax Credit, and Child and Dependent Care Tax Credit without the temporary increases in place during the early pandemic, and is based on household child-care expenditures given the level of child-care subsidies under the CCDBG in 2019. We use data from the National Survey of Early Care and Education (NSECE) and the American Community Survey to determine the current combinations of work (none, full time, or part time) and type of child care (center, home-based, and whether paid or not) under current policies for the baseline. We also use the NSECE data to obtain estimates of worker-to-enrollment ratios, wages, and education levels for the ECE workforce to develop a production function for the supply of ECE services. Details on the equilibrium model—which accounts for changes in both supply of ECE services by providers and demand for those services from families jointly determined with a model of labor force participation—are contained in the paper. (Back to top)
- We also simulate a third policy that adds wage floors to the broad expansion policy, adding a requirement that ECE teachers without a bachelor’s degree have hourly wages of at least $15 and teachers with a bachelor’s degree have wages comparable to a kindergarten teacher with similar educational credentials. These wage floors change the results only slightly. See paper for details. (Back to top)
Related Content


Authors


Commentary
Fixing child care: What expanded public subsidies could mean for children, families, and teachers
June 14, 2022