Update 11/16/21: Language was added to clarify that the full paper, unlike the analysis within blog post, includes data from the New York City Public School District.
Title I funds, a block grant aimed at increasing education spending for low-income students, are just a sliver of what the U.S. spends on education. The Biden administration has proposed more than doubling funding for the program from $16.5 billion to $36.5 billion, but even with such an expansion, Title I spending would still only comprise about 5% of the $753.2 billion the country spends on education annually. This is why some scholars have argued that a $36.5 billion Title I program would not be enough to eliminate spending gaps between students.
In this post, we show that the proposed increase in Title I funding could substantially reduce national spending gaps, but it would need to be well targeted. As others have noted, Title I status only moderately correlates with poverty and is therefore an imperfect mechanism for distributing aid. In this article, we consider how additional Title I funds could improve funding equity if these funds were spent specifically to reduce spending inequalities. Under this scenario, we assume that federal aid can be approximately distributed directly to students akin to a weighted student funding formula, though such an arrangement cannot guarantee that the targeted group has exclusive access to the additional resources.
The federal government has many educational goals it can pursue with policy, some of which include: eliminating spending gaps between different subgroups of students; increasing spending for vulnerable student populations where spending is low; or providing an adequate level of spending for all students. Each of these policy goals will have different costs and benefits. In this post, we focus on the first of these two goals, paying particular attention to Black, Hispanic, and economically disadvantaged subgroups of students. We also recognize that many other students—American Indian, Asian, white, and economically advantaged—attend schools where spending is far below the national average, and the educational needs of these students are important as well.
Current spending gaps for Black, Hispanic, and economically disadvantaged students are substantial. In a previous post on the Chalkboard, we showed that, on average across the country, Black and economically disadvantaged students in the U.S. receive about $400 less per pupil than white and economically advantaged students, respectively. The spending gap for Hispanic students is particularly alarming: Hispanic students receive nearly $1,200 less per pupil than white students. And though current Title I funding keeps these spending gaps from being larger, it is not currently enough to eliminate them completely. Here, we illustrate how additional funding for Title I could substantially reduce education spending inequalities in the U.S. As in our previous post on the Chalkboard, we exclude the New York City Public School District from these calculations.
How much money would it take to eliminate national spending gaps?
On average across the U.S., white students receive $15,048 in per-pupil spending, which is $396 more than Black students receive and $1,168 more than Hispanic students receive. Using eligibility for free and reduced-price lunch (FRL) to proxy for economic disadvantage, economically advantaged students receive, on average, $14,774 in per-pupil spending, which is $431 more than economically disadvantaged students receive.
If funds could be precisely targeted to individual students, these spending gaps could be closed, for example, by increasing spending by $396 for each Black student. The cost of doing so would be approximately $3 billion to close the Black-white spending gap, $15.6 billion to close the Hispanic-white spending gap, and $10.6 billion to close the FRL to non-FRL spending gap. We obtain these numbers by simply multiplying the amount of the spending gap by the size of the Black, Hispanic, or FRL student populations, respectively.
Still, while eliminating spending gaps between student subgroups is certainly an important policy goal—and accomplishing this goal is well within the proposed Title I expansion—not all students will reach nearly the national average level of spending if aid is provided to all students equally. For example, over 1 million Hispanic students attend school in districts where per-pupil spending is $4,000 below the national average. Increasing their per-pupil funds by $1,168 would still leave them far below the national average.
To provide a more ambitious level of aid, we describe how much it would cost for all Black, Hispanic, or FRL students to obtain spending levels at the national average for white or economically advantaged students. To determine how much money would be needed to bring all student groups up to these national benchmarks, we identify those districts where per-pupil spending falls below the national average for white or economically advantaged students. For each of these districts, we take the difference between how much a district spends per pupil relative to the national benchmarks and use enrollment for Black, Hispanic, or economically advantaged students to calculate how much funding the district would need to equalize spending. In effect, what we are saying is that some districts will get more aid based on how far their current level of spending is from the national average. Summing across all districts gives the total national cost needed to equalize spending; those costs are shown in Table 1.
Table 1: Counts of Black, Hispanic, and economically disadvantaged students below parity and cost to reach parity
| Number below mean white/non-FRL | Total cost to attain mean white/non-FRL spending | |
| Black students | 4.6 million | $12.4 billion |
| Hispanic students | 9.5 million | $27.1 billion |
| FRL-eligible students | 15.7 million | $40.4 billion |
Here, too, the amount needed to bring all Black and Hispanic students up to a level of spending equal to the national average for white students falls roughly within the scope of the Biden administration’s Title I proposal. Bringing spending for all economically disadvantaged students to the average for economically advantaged students would require about 14% more aid than the current proposal. (We are unable to estimate the total cost to close spending gaps for Black, Hispanic, and FRL-eligible students because our data do not show which Black and Hispanic students are also FRL-eligible. Many Black and Hispanic students are eligible for FRL, meaning that increasing spending for vulnerable students will also increase spending for FRL-eligible students.)
The above numbers might surprise many readers. They show that the proposed Title I expansion could radically alter the distribution of funding for student subgroups, elevating spending for students at the very bottom of the distribution up to national averages.
Taking this a step further, we can cost out a more ambitious goal: an increase in spending for all Black, Hispanic, or economically disadvantaged students up to the 75th or 90th spending percentiles nationally (for all students). This would lead to per-pupil spending amounts of $16,111 and $20,490, respectively. These costs are shown in Table 2.
Table 2: Counts of Black, Hispanic, and economically disadvantaged students below 75th and 90th percentiles and cost to reach thresholds
| 75th percentile goal | 90th percentile goal | |||
| No. of students below 75th percentile | Total cost to obtain 75th percentile | No. of students below 90th percentile | Total cost to obtain 90th percentile | |
| Black students | 5.2 million | $17.6 billion | 6.1 million | $42.7 billion |
| Hispanic students | 10.2 million | $37.6 billion | 11.6 million | $85.7 billion |
| FRL-eligible students | 18.0 million | $85.7 billion | 21 million | $149.6 billion |
Policies aimed at increasing spending for all Black, Hispanic, or economically disadvantaged students to levels of spending at the 75th or 90th percentiles would have a double advantage of benefiting more students and providing additional spending to compensate for longstanding educational disadvantages and ongoing structural inequalities. Such compensatory funding is supported by voters who want traditionally disadvantaged students to have additional educational opportunities as a way of leveling the playing field. The fact that nearly all states spend more on economically disadvantaged students suggests voters and policymakers prefer a spending distribution that is compensatory, not simply equal.
Of course, increasing spending so that all student subgroups reach these higher levels of spending incurs higher costs. Reaching the 75th percentile benchmark ($16,111 per pupil) remains roughly within the proposed Title I expansion for Black or Hispanic students, though the cost for both student groups to reach the 75th percentile nationally would be $55.2 billion. Obtaining levels of spending at the 90th percentile would be feasible for Black students, but much costlier for Hispanic and FRL-eligible students.
Where would the money go?
It’s important to note that the root causes of educational spending inequalities in the U.S. are the large spending differences across states and the reality that many disadvantaged students live in lower-spending or less-progressive states (with respect to school funding). To bring Black, Hispanic, or FRL students up to national average spending levels, more Title I funds would need to go to states that spend less on education in general or spend less on disadvantaged students in particular and serve higher proportions of disadvantaged students.
In Figure 1, we show what share of the hypothetical Title 1 funding each state would receive for Black, Hispanic, or FRL per-pupil spending to reach spending levels at the 75th percentile relative to the share of each state’s actual enrollment of Black, Hispanic, or FRL students.[1] In other words, we generate a ratio that tells us whether the state’s spending gap is greater than what would be expected based on the state’s enrollment alone. Values of one mean that the state is getting a share of Title I greater than its enrollment share (i.e., the state currently underspends on its disadvantaged students); values less than one mean that the state is getting a smaller share of Title 1 relative to its enrollment share (i.e., the state already allocates more funding to its disadvantaged students).
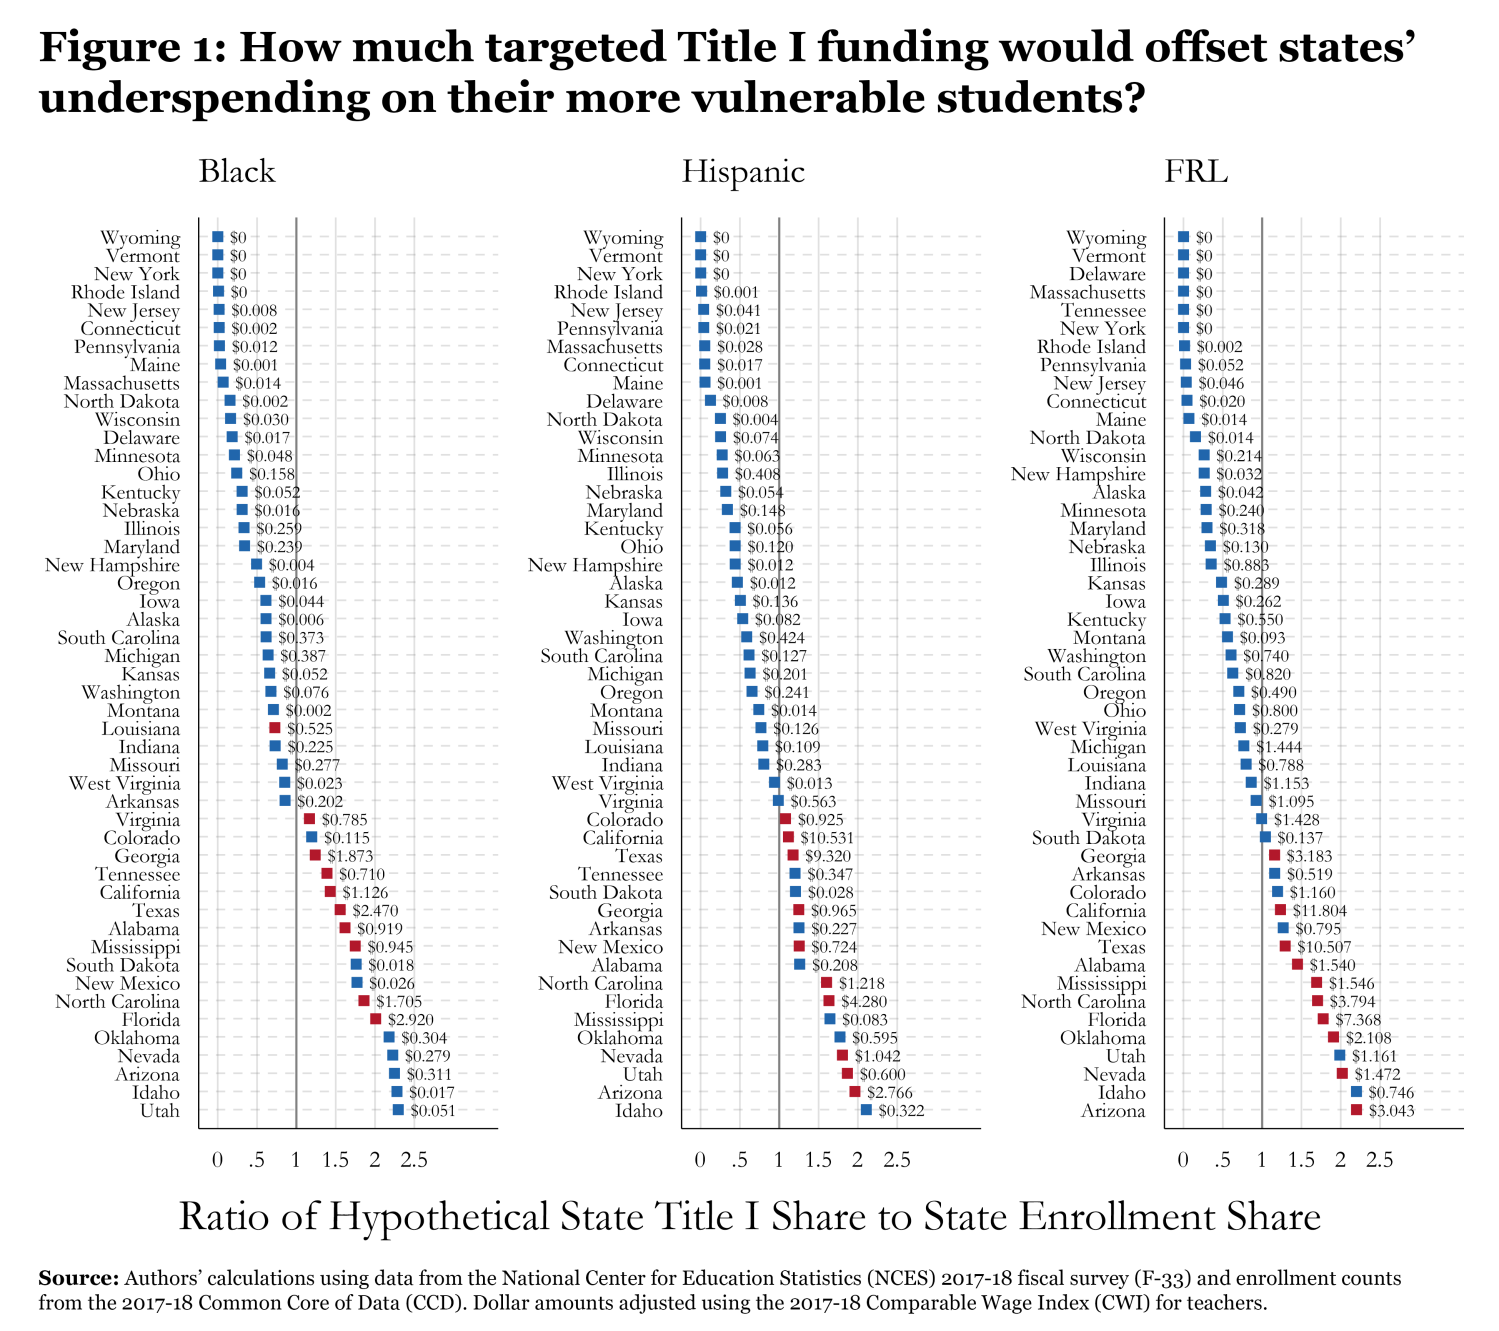
Taking the example of Hispanic students, who face the largest national spending inequalities, certain states would clearly receive more Title I funding under a policy geared toward funding Hispanic students at the 75th percentile. Florida and Texas, which together educate more than 28% of Hispanic students, would receive a cumulative 36% of proposed aid (i.e., $13.6 billion of the $37.6 billion this policy would cost). In contrast, Massachusetts, New Jersey, New York, and Pennsylvania would receive almost no aid, even though these states enroll 11% of the Hispanic population. In general, nearly all states that would receive the most money (shown in red) also receive a greater share of the money than their populations alone would legitimate.
Of course, this type of expansion to Title I, if not designed carefully, could reward states that are lower-spending and/or more regressive in their spending and punish (via increased taxes) states that are higher-spending and/or more progressive in their spending. This motivates current proposals to incentivize states to increase education spending along with other initiatives to ensure that states do not reduce spending if additional federal aid is provided.
Overall, though, the Biden administration’s proposed expansion of Title I to $36.5 billion represents a real opportunity to substantially increase spending for vulnerable student populations. However, the policy can only successfully accomplish this goal if funds target student subgroups with the lowest levels of spending directly, which would mean restructuring how Title I is distributed.
[1] This figure plots the ratio of two statistics: (i) percentage of total hypothetical federal funds each state would need to receive for Black, Hispanic, or FRL-eligible students to reach the 75th percentile of national spending, and (ii) the percentage of total enrollment in each state of Black, Hispanic, or FRL-eligible students. Adjacent to each marker symbol is the amount of actual aid (in $billions) each state would receive. Markers in red indicate the 10 states receiving the greatest amount of aid. Thus, for example, for Black students in Florida to reach the 75th percentile of per-pupil spending, Florida would receive about $2.9 billion and about two times more aid than would be expected based on their enrollment. (Back to top)
Related Content

Authors


Commentary
Expanding Title I could eliminate K-12 spending gaps—if the funds are well targeted
August 19, 2021