
This piece provides highlights and insights from a Brookings report entitled, “Is the rise in high school graduation rates real? High-stakes school accountability and strategic behavior.“
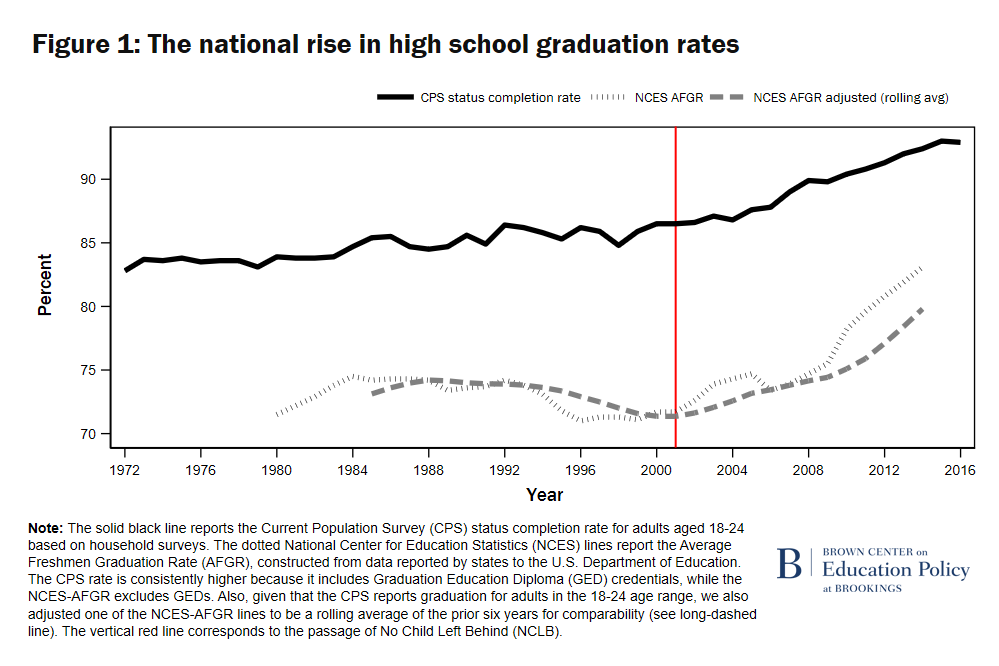
One of the greatest apparent achievements in U.S. education in the past two decades has been the steep rise of the U.S. high school graduation rate. For decades, the percentage of 18-24 year-olds who completed high school with a regular diploma or GED hovered around 85%. Since 2001, however, there has been a sharp increase, arguably the fastest rise since the early 1900s. Between 2001 and 2016, the percentage of 18-24 year-olds with a credential increased to 93%—an 8-percentage-point increase (see Figure 1).
Yet, this seemingly grand achievement has been met with little fanfare. Why? Because few close observers seem to believe it. The main concern is that schools may have made it easier to complete high school through lax course grading, GEDs, and “credit-recovery programs” that allow students to pass without learning much. Newspaper headlines are also now replete with examples of scandals—including Montgomery County, Maryland; New Orleans; Washington, D.C.; and more—where it appears that graduation rates have been inflated.
This suspicion is fueled by the timing of the increase. The uptick started in the early 2000s, just after No Child Left Behind (NCLB) passed into law. In addition to the law’s well-known focus on test scores, NCLB also gradually added accountability for high school graduation. At first, the attention to graduation was relatively limited, but, in 2007, states were required to set specific targets that schools had to reach in order to make “adequate yearly progress” and use a common metric, called the average cohort graduation rate. The pressure was on to raise graduation rates.
The question is, how exactly did schools respond? Did they try to genuinely improve the quality of instruction so that students would want to stay in school? Or did they game the system? In other words, is the steep increase in high school graduation only an accountability-fueled mirage, or does it reflect a real improvement in human capital? The mirage interpretation seems especially plausible given the pressure schools were under and the fact that they control the data used to calculate graduation rates.
I sought to answer these questions with my colleagues, Lihan Liu, Nathan Barrett, and Rosie Li. In the longer technical report, we started by studying whether the timing of the improvement really was caused by NCLB, using data on essentially all publicly funded schools in the country.
This leads to our first main conclusion: NCLB increased high school graduation rates. We find that the rise in high school graduation really was very likely caused by accountability. States with more districts below the statewide NCLB-induced graduation thresholds saw larger increases in graduation. Moreover, districts that were below the threshold saw the largest graduation increases, within their respective states.
Given the possibility that schools responded to accountability through strategic behavior and/or genuine school improvement, we carried out four additional types of analysis of specific forms of strategic behavior. This leads to the following findings:
- There was no relationship between increase in graduation rates and presence of graduation exams. Using national, state-level data from the Current Population Survey (CPS), we provide evidence that graduation rate increases were no different in states that had graduation exams versus those that did not. Since graduation exams make it more difficult for schools to relax academic standards, this provides no evidence of strategic behavior and therefore provides some support for the human capital interpretation.
- GED rates declined after NCLB. We find that the rate of GED completion declined after NCLB. This is unsurprising given that the federal law generally did not allow states to count GEDs toward graduation/completion rates. Again, this suggests that credential quality did not decline and may have actually increased.
- There was some increase in credit recovery, but not enough to explain graduation rates. Using detailed data from Louisiana, we provide evidence that accountability pressure likely caused an increase in credit-recovery courses. This is more consistent with the mirage interpretation, although the change in credit recovery—at least in Louisiana—doesn’t appear to be nearly enough to explain the steep rise in high school graduation described above.
- Accountability (slightly) increased other forms of strategic behavior, but this cannot explain the overall graduation rate increase. Using the detailed data from Louisiana, we studied manipulation of the “exit codes” that underlie the graduation rates reported by states. In this case, we find data manipulation appears rare, at least in Louisiana. Even where it occurs, it doesn’t likely affect the national trends.
The ultimate question is, to what degree is the rise in high school graduation rate real? This is a difficult question to answer, but our analysis suggests that graduation accountability led to a real increase in human capital as well as some strategic behavior. Below, we summarize the analysis and the results, piece by piece.
NCLB increased high school graduation rates
The first question is, did accountability really cause the recent increase in graduation rates? To answer this, we divided up districts based on whether their graduation rates were below the state-determined minimum thresholds. States had considerable latitude to set these thresholds and varied widely in the percentage that were threatened. If graduation accountability was driving graduation rates, we would expect to see larger changes in graduation rates in districts whose rates were below the state standard.
The results were exactly as predicted. As Figure 2 shows, the rise in graduation rates was greatest in low-graduation-rate districts, which experienced the sharpest increase in graduation pressure. Conversely, the smallest changes in graduation rates post-NCLB were in districts that were above their state thresholds. (In more advanced analysis, we carried out regression analyses by comparing districts only to others within the same state, and controlled for various district characteristics. The results from this more advanced analysis were similar to Figure 2, and statistically different between the groups of districts.)
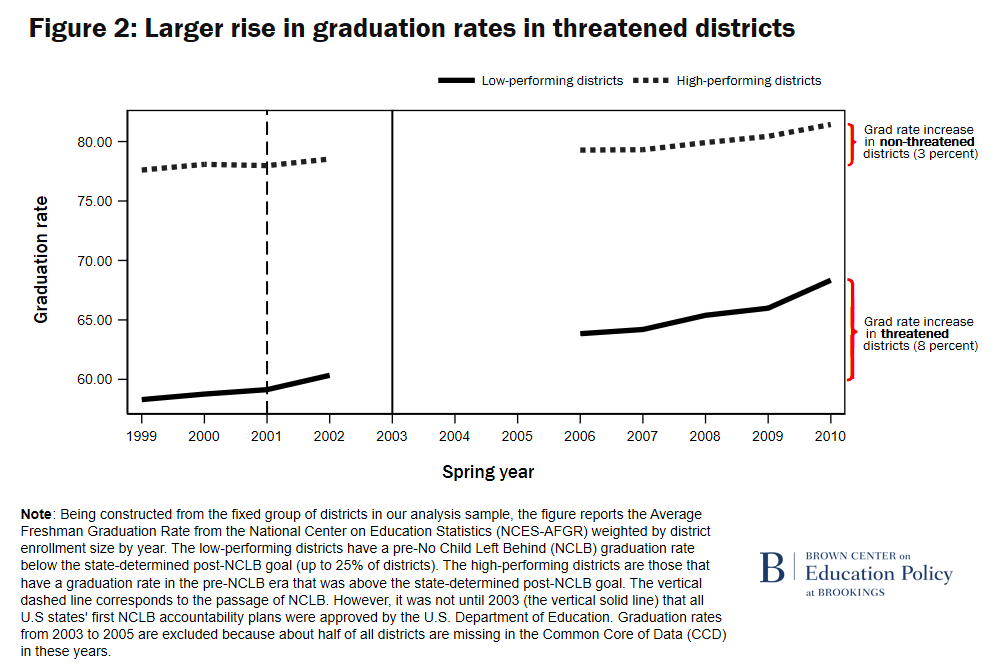
This figure is important because it suggests that graduation accountability did indeed drive graduation rate improvement. If some other factor, such as economic conditions or improvements in other education policies, had been the driving force, then we might have been less worried that the graduation rate increase was a mirage. Figure 2 suggests that more analysis is needed to determine whether the increase in graduation rate is real or due to strategic behavior.
No relationship between increase in graduation rates and presence of graduation exams
We compared the state patterns in graduation rates with the use of state graduation exit exams. Our logic is that it would be more difficult for schools to reduce the quality or rigor of high school degrees in states that have such exams.
Figure 3 shows the increase in graduation rates, where the darker colors signify larger changes in high school graduation.
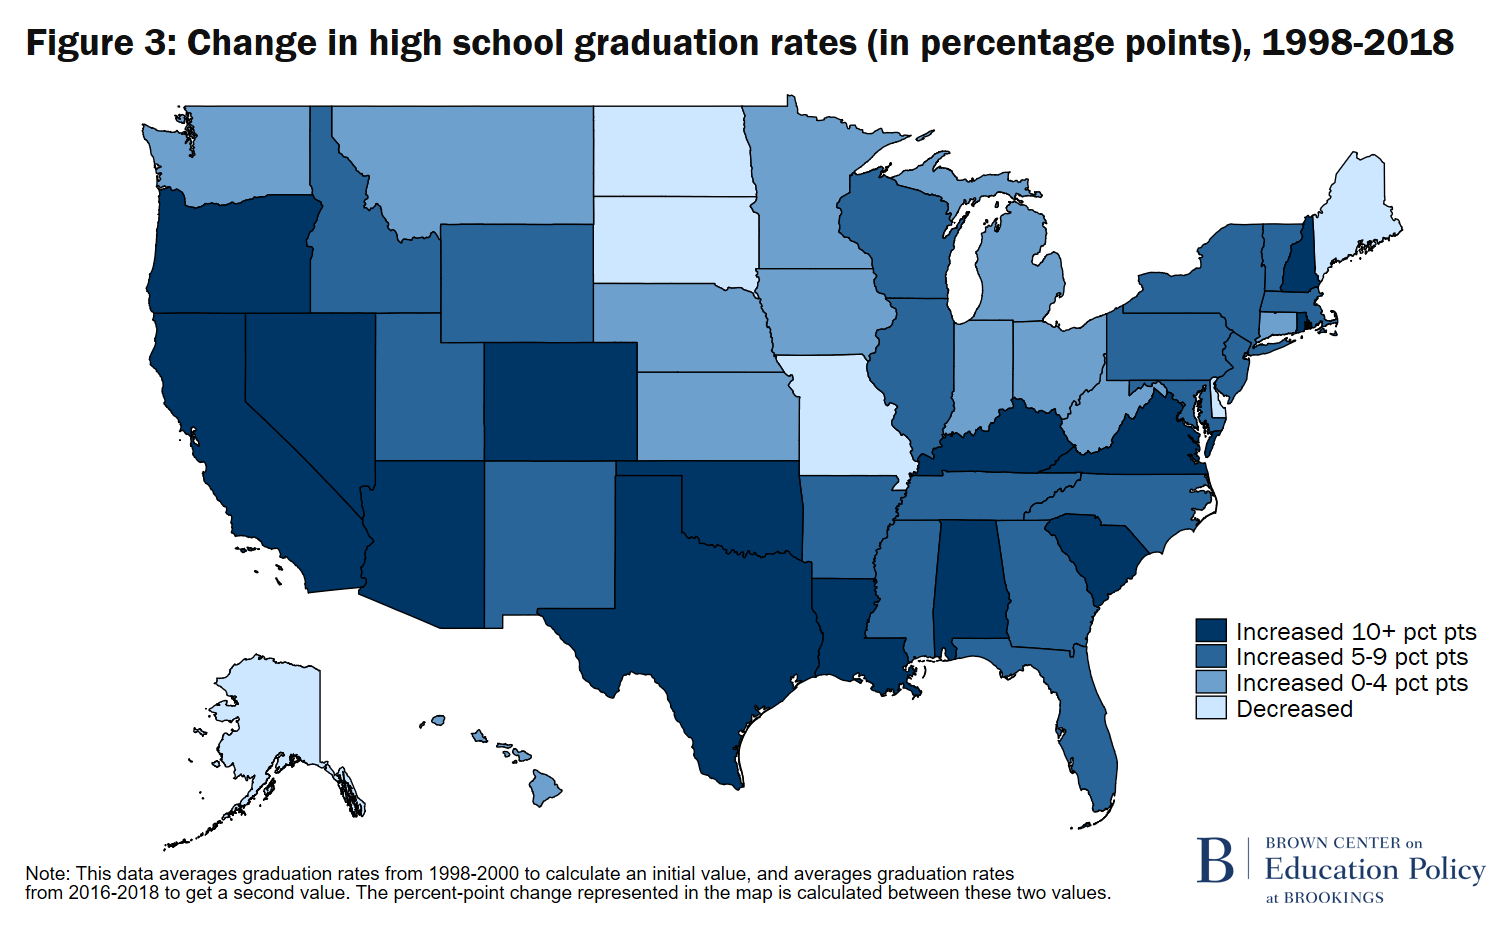
In additional analysis found in the technical report (not shown in the map), we also calculated the average graduation rate increase for states with different graduation policies. We see no evidence that the rise in graduation rates was due to a decline in standards. In fact, the opposite pattern emerges: the largest graduation increases were in states that maintained graduation exams.
This analysis has some limits to be sure. In particular, students can pass state graduation exams with only an 8th-grade level of understanding. So, it could be that Figure 3 is entirely capturing other factors driving graduation rates. However, note that, with a baseline graduation rate around 85%, the students on the margin of graduation might find even these modest standards to be difficult. Also, note that prior research on graduation exams suggests that they do, in fact, reduce graduation rates; such effects would not arise if passing the graduation exam was automatic. Thus, if degree quality declines, we should see a faster rise in graduation rates in states with no exit exams.
So far, the analysis suggests no evidence of declining degree quality.
Decline in GED rates
In this case, we have limited opportunity for analysis because GED completion rates are only available at the national level and only for certain years. However, we can construct a simple time trend of GED completions before and after NCLB. These data suggest that GEDs have declined in both absolute and relative terms. The ratio of GEDs to regular high school diplomas declined from 0.17 in 2000 to 0.14 in 2008. Other evidence suggests a further decline thereafter.
Some increase in credit recovery, but not enough to explain graduation rates
Graduation standards might also have declined through increases in credit-recovery courses. The word “recovery” signals that these courses are designed for students who have already fallen behind and failed some courses. Credit-recovery programs operate increasingly online, with the extent of instruction limited and difficult to track. They are also “competency-based” in that students only have to pass a test in order to pass the course, and some principals told us that students can often access the internet while testing—and repeat the test until they pass.
To study online credit recovery, we used detailed student-level longitudinal data from Louisiana. While we cannot identify credit-recovery courses directly, we can observe course re-takes. After the point where the credit-recovery courses became available, these re-takes are likely to be credit recovery.
Our results confirm that credit-recovery courses did increase. Also, consistent with the accountability explanation, they increased more in schools that are threatened by accountability sanctions (even after controlling for student background).
The size of these changes, however, is too small to explain the overall increase in high school graduation reported in Figure 1. Even if every new course re-take is a credit-recovery course, and even if every student taking a credit-recovery course would not have otherwise graduated (neither of which is likely), this would still be insufficient to explain the increase in graduation rates. This is especially true in Louisiana, where the graduation rate increased even more than the average state: From 2005-06 to 2017-18, the rate increased from 64% to 81%.
Even if we are wrong, or credit recovery increased more in states other than Louisiana, it would still not necessarily mean that the increase in high school graduation is a mirage. While students seem to learn less in credit-recovery courses than regular, in-person courses, students are probably still learning something in credit-recovery courses. And the availability of credit recovery could lead students to stay in school longer and participate in more regular courses, increasing human capital further.
Accountability (slightly) increased other forms of strategic behavior, but this cannot explain the overall graduation rate increase
Graduation rates are just that—rates. They have a numerator (number of students who graduate) and a denominator (number of students who could have graduated). School leaders could manipulate the numerator by making it easier to graduate. They could also manipulate the denominator by assigning “legitimate” exit codes to students who actually drop out, thus removing them from graduation rate calculations altogether.
In our conversation with school leaders in Louisiana, we learned that three exit codes are most likely to be used in this way: exits to private schools, exits out of state, and exits to homeschooling. In all three cases, it is difficult for the state to verify the exit code. If students transferred to other public schools, then state officials could see it in their own data system, making it less likely that schools would manipulate data in this way.
We see limited evidence of strategic behavior involving exit codes in Louisiana. There is only a very slight increase in hard-to-verify legitimate exits. Also, again, even if we were understating this form of strategic behavior, these would “cancel out” in the national figures reported by the CPS and NCES-AFGR measures in Figure 1; therefore, this form of strategic behavior cannot explain the national graduation rate rise.
Conclusion: The rise in high school graduation likely reflects a real increase in human capital as well as some strategic behavior
The public is right to be worried about sudden changes in performance metrics when they become high-stakes. Any increase in such measures almost certainly exaggerates the real changes in outcomes, especially in the school and district measures that local newspapers often report. For this reason, we recommend the following:
- States can and should do more to audit the data that go into these measures. In Louisiana, for example, the state carries out annual sample audits of samples of exit codes, which may be why we saw limited data manipulation.
- States should also work to ensure degree quality. It is important to look carefully at the quality of programs allowing students to catch up after failing courses. We are not necessarily advocating graduation exams, but there are other ways to help ensure quality.
While we need to work to improve the data, we can also swing too far in the other direction—and too-easily dismiss the measures we have now. Yes, there are many ways to manipulate high school graduation measures, and some of this did occur. But, even in the worst-case scenarios laid out here, the evidence suggests that the accountability helped increase the national high school graduation rate—and produced some real and important knowledge and skills for students. Given the value of high school degrees generally, this is a great accomplishment.
At a time when the past two decades of accountability reforms are increasingly seen as a failure, our analysis suggests that graduation accountability has been a meaningful success story.
Related Content


Authors