The federal government provides nearly $30 billion in grant aid each year to nearly 8 million students from lower-income families (mainly with household incomes below $50,000 per year) through the Pell Grant program, which can give students up to $5,920 per year to help pay for college. Yet in spite of research showing that the Pell Grant and similar need-based grant programs are effective in increasing college completion rates, there are still large gaps in graduation rates by family income. For example, among students who began college in the fall 2003 semester, Pell recipients were 7 percentage points less likely to earn a college credential within six years than non-Pell students.
Despite the federal government’s sizable investment in students, relatively little has been known about whether Pell recipients succeed at particular colleges. The last Higher Education Act reauthorization in 2008 required colleges to disclose Pell graduation rates upon request, but two studies have shown that colleges have been unable or unwilling to disclose these data. This means that before now, little has been known about whether colleges are able to graduate their students from lower-income families.[1]
The U.S. Department of Education recently updated its Integrated Postsecondary Education Data System (IPEDS) to include long-awaited graduation rates for Pell Grant recipients, and I focus on graduation rates for students at four-year colleges (about half of all Pell recipients) in this post. I examined the percentage of Pell recipients and non-Pell recipients who graduated with a bachelor’s degree from the same four-year college within six years of entering college in 2010.[2] After limiting the sample to four-year colleges that had at least 50 Pell recipients and 50 non-Pell recipients in their incoming cohorts, my analysis included 1,266 institutions (504 public, 747 private nonprofit, and 15 for-profit).
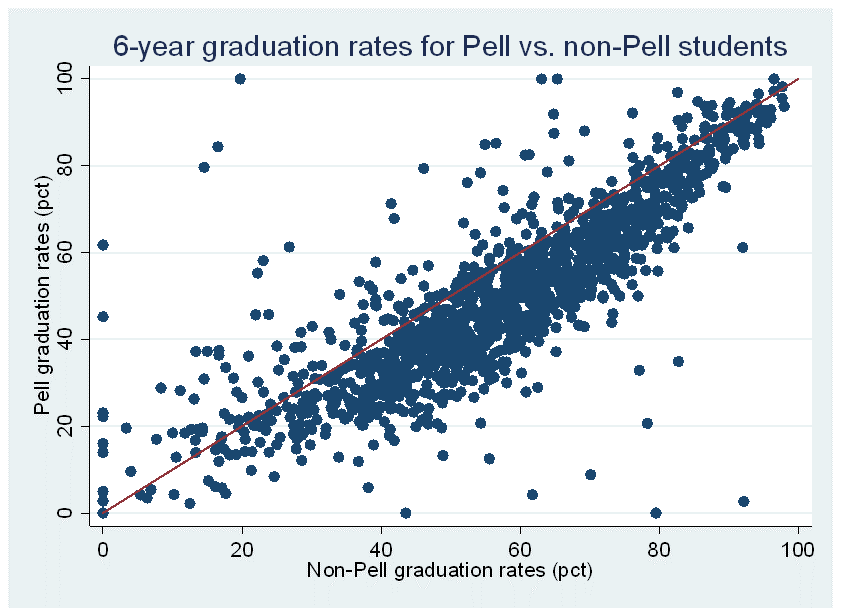
The average six-year graduation rate for Pell recipients in my sample was 51.4 percent, compared to 59.2 percent for non-Pell recipients. The graphic below shows the graduation rates for non-Pell students on the horizontal axis and Pell graduation rates on the vertical axis, with colleges to the left of the red line having higher graduation rates for Pell recipients than non-Pell recipients. Most of the colleges (1,097) had non-Pell graduation rates higher than Pell graduation rates, but 169 colleges (13.3 percent) had higher Pell graduation rates.

Table 1 below shows five colleges where Pell students graduate at the highest and lowest rates relative to non-Pell students.[3] For example, the University of Akron (which had 3,370 students in its incoming class of first-time, full-time students) reported that just 8.8 percent of its 1,505 Pell recipients in its incoming class graduated within six years compared to 70.1 percent of its 1,865 non-Pell students—a yawning gap of 61.3 percent and the second-largest in the country. Assuming the Pell and non-Pell graduation rates are not the result of a data error that the university made in its IPEDS submission, this is a serious concern for institutional equity. On the other hand, some colleges had far higher graduation rates for Pell recipients than non-Pell students. An example is Howard University, where 79.4 percent of Pell recipients and just 46.1 percent of non-Pell students graduated.
| Table 1: Colleges with the largest Pell/non-Pell graduation rate gaps. | ||||||
| Name | State | Number of new students | Pct Pell | Pell grad rate | Non-Pell grad rate | Gap |
| Saint Augustine’s University | NC | 440 | 76.8 | 2.7 | 92.2 | -89.5 |
| University of Akron | OH | 3370 | 44.7 | 8.8 | 70.1 | -61.3 |
| St. Thomas Aquinas College | NY | 290 | 31.7 | 20.7 | 78.3 | -57.6 |
| Southern Virginia University | VA | 226 | 64.2 | 20.7 | 54.3 | -33.6 |
| Upper Iowa University | IA | 201 | 51.7 | 27.9 | 60.8 | -32.9 |
Of the colleges with at least 50 Pell and 50 non-Pell recipients, 97 had graduation rates of over 80 percent for both Pell and non-Pell students. Most of these colleges are highly selective institutions with relatively low percentages of Pell recipients, but six institutions had Pell and non-Pell graduation rates above 80 percent while having at least 30 percent of students in their incoming class receive Pell Grants. All six are in California, with five in the University of California system (Davis, Irvine, Los Angeles, San Diego, and Santa Barbara) and one private institution (Pepperdine). This suggests that it is possible to be both socio-economically diverse and successful in graduating students.
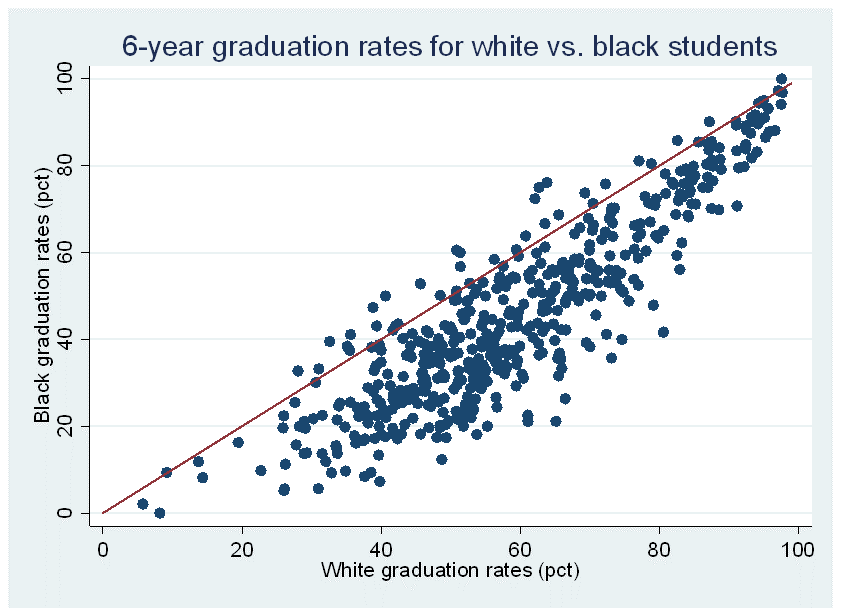
As a comparison, I also examined the black/white graduation rate gaps for the 499 colleges that had at least 50 black and 50 white students in their graduation rate cohorts. The average black/white graduation rate gap at these colleges was 13.5 percent (59.0 percent for white students compared to 45.5 percent for black students). As the figure shows below, only 39 colleges had higher graduation rates for black students than for white students, while the other 460 colleges had higher graduation rates for white students than black students.

Fourteen colleges had higher graduation rates for Pell recipients than non-Pell students and for black students than white students. This group includes elite institutions with small percentages of Pell recipients and black students, such as Dartmouth, Duke, and Yale as well as broader-access and more diverse colleges, such as CUNY York College, Florida Atlantic, and South Carolina-Upstate. Table 2 shows the full list of 14 colleges that had higher success rates from Pell and black students than non-Pell and white students.
| Table 2: Colleges with higher graduation rates for Pell and black students. | |||||
| Name | State | Pell grad rate | Non-Pell grad rate | Black grad rate | White grad rate |
| U of South Carolina-Upstate | SC | 50.4 | 34.0 | 47.3 | 38.8 |
| CUNY York College | NY | 31.5 | 27.3 | 32.7 | 28.0 |
| Agnes Scott College | GA | 71.1 | 68.3 | 72.4 | 62.1 |
| Clayton State University | GA | 34.0 | 31.5 | 33.2 | 31.0 |
| Duke University | NC | 96.6 | 94.3 | 95.1 | 95.0 |
| Florida Atlantic University | FL | 50.6 | 49.0 | 50.1 | 48.5 |
| Wingate University | NC | 54.5 | 53.1 | 60.0 | 51.4 |
| UMass-Boston | MA | 45.8 | 44.7 | 50.0 | 40.6 |
| U of South Florida | FL | 68.1 | 67.1 | 68.7 | 65.5 |
| CUNY City College | NY | 47.2 | 46.3 | 52.8 | 45.6 |
| Dartmouth College | NH | 97.2 | 96.5 | 97.3 | 97.1 |
| CUNY John Jay College | NY | 44.1 | 43.4 | 43.5 | 42.4 |
| Yale University | CT | 98.2 | 97.7 | 100.0 | 97.6 |
| Stony Brook University | NY | 72.5 | 72.3 | 71.3 | 70.5 |
The considerable variation in Pell recipients’ graduation rates across colleges deserves additional investigation. Colleges with similar Pell and non-Pell graduation rates should be examined to see whether they have implemented any practices to support students with financial need. The less-selective colleges that have erased graduation rate gaps by race and family income could potentially serve as exemplars for other colleges that are interested in equity to emulate. Meanwhile, policymakers, college leaders, and the public should be asking tough questions of colleges with reasonable graduation rates for non-Pell students but abysmal outcomes for Pell recipients.
Finally, the U.S. Department of Education deserves credit for the release of Pell students’ graduation rates, as well as several other recent datasets that provide new information on student outcomes. This includes new data on students’ long-term student loan default and repayment outcomes and the completion rates of students who were not first-time, full-time students, along with an updated College Scorecard that now includes a nifty college comparison tool. Though the Pell graduation rate measure fails to cover all students and does not credit institutions if a student transfers and completes elsewhere, it is still a useful measure of whether colleges are effectively educating students from lower-income families. In the future, student-level data that includes part-time and transfer students would be useful to help examine whether colleges are helping all of their students succeed.
Footnotes
- Focusing on Pell Grant recipients undercounts the number of lower-income students because a sizable percentage of lower-income students do not file the Free Application for Federal Student Aid, which is required for students to be eligible to receive a Pell Grant.
- I calculated the number of non-Pell recipients by subtracting the number of Pell recipients from the total graduation rate cohort in the IPEDS dataset.
- This excludes two colleges that reported a 0 percent or 100 percent graduation rate for their Pell students, which is likely a data reporting error.


Commentary
A look at Pell Grant recipients’ graduation rates
October 25, 2017