Editor’s Note:
This post originally appeared on U.S. News and World Report’s
Knowledge Bank
blog.
Weeks ago, researchers Matthew Kraft and Allison Gilmour released a new study demonstrating the “Widget Effect” is alive and well in our schools. Their study is a re-examination of TNTP’s influential 2009 study that coined the phrase, referring to the tendency to treat teachers as interchangeable widgets when they are known not to be.
The original study highlighted the disconnect between how education leaders and administrators perceive the effectiveness of the teacher workforce – with significant shares of both high and low performers – and the actual distribution of teacher ratings, which rated over 99 percent of teachers as effective or better.
Kraft and Gilmour’s new release is a needed update, as states have seen a flurry of legislation in the intervening years focused on revamping teacher evaluations. Yet, even with the updated evaluation systems, the new study only finds modest changes in the number of teachers rated effective or better (now 97 percent).
It is tempting to look at the tenacity of this Lake Wobegon effect and find fault with actors in the system somewhere. Indeed, Kraft and Gilmour conducted interviews with principals and identified several reasons for going soft on low-performing teachers, including time constraints, a reluctance to harm morale and personal discomfort. Yet, according to the study, principals’ tendency to tread lightly for some teachers does not appear to explain much of the gap between perception and ratings.
I argue that no small part of the gap still unexplained in the Kraft and Gilmour study is likely due to the actual design of the evaluation systems. Based on my prior work in teacher evaluation systems, both theoretical and in consultation for actual systems, I have found that systems’ designs commonly work in several ways that may end up undermining their purpose.
Where evaluations are intended to separate out high and low performers (and perhaps several shades in between), systems’ designs aggregate disparate measures in unintuitive ways and mask over underlying variations between individuals. No doubt many of these design features were intended to hone in on effectiveness using what is a relatively subjective evaluation process, but I personally have been surprised at how much a difference some of these seemingly innocuous design decisions can make. Let me briefly describe three features that seem innocent in theory, but could end up severely reducing much of the desired variation in an educator evaluation system.
Many evaluation items, all equally weighted
Identifying effective teaching is an inexact exercise, and most states have adopted multiple performance measures on the premise that no one measure adequately captures all of teaching. And even within a type of performance measure (for example, classroom observation), there are many individual items on the rubric where teachers are evaluated on discrete parts of teacher practice (like facilitating small-group instruction or assessing students’ understanding). In line with what Kraft and Gilmour find, evaluators tend to be stingy with low ratings and more liberal on high ratings, with most rated as “proficient,” even on these individual items.
The problem is these many individual items are simply averaged to compute a teacher’s score, though they are unlikely to equally reflect teacher effectiveness. In some districts, these rubrics may contain many items while others have relatively few. Paradoxically, given the evaluators’ tendency to rate most teachers as “proficient” most of the time, adding more equally weighted (though marginally less informative) items to the rubric tends to average all teachers’ performance out. Thus, rather than filtering the noise to amplify the signal, this exercise adds more noise with progressively less signal.
Using hypothetical data (based on actual distributions in districts I’ve worked with), Figure 1 shows how adding more items makes all teachers appear more average (note: measures are based on a 4-point integer scale commonly used in evaluation, where a value of 3 represents “proficient”). The 15-item rubric leaves more teachers on the extremes of the distribution, while the 25- and 35-item rubrics pull them tighter around the average.
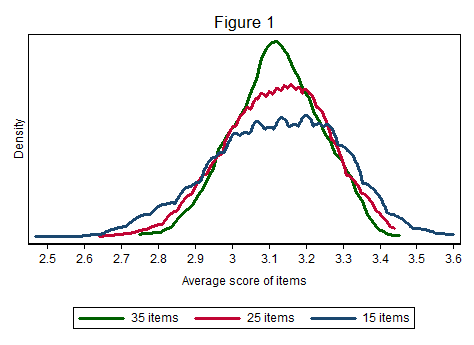
States and districts would be well advised to weigh each item used in all evaluation rubrics and clear away those judged to be redundant or less important to focus attention on those deemed most revealing of teachers’ performance. As a bonus, teachers may also prefer the streamlined rubrics rather than hustling to demonstrate excellence on more than 30 discrete items during a 20-minute observation.
Rounding scores to categorize performance
By design, evaluation systems are taking assessed performance on many individual measures and combining them in some way to arrive at a single final rating. Somewhere in the process, complex averaged values reflecting multiple measures will somehow be categorized, and simply rounding numbers with decimals to the nearest whole value is a common strategy to do this.
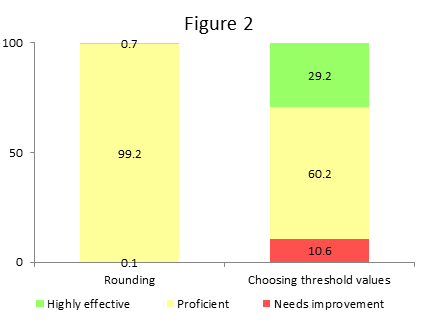
If we had to categorize teachers in Figure 1 above into low, average and high performance, what boundaries would you choose? The rounding process chooses the values of 2.5 and 3.5 as these boundary points, though this is likely not optimal for most systems. And when most teachers are “proficient” on most items most of the time, it’s unsurprising that average scores deviated very little from the mean. Rounding the average scores in Figure 1 arrives at a distribution of teachers where 0.1 percent “need improvement” and 0.7 percent are “highly effective,” while the remaining 99.2 percent are “proficient” (see column 1 of Figure 2). Do these numbers sound familiar?
States and districts should consider choosing threshold values carefully, and not allowing the rounding function to choose them and thus reinforce the tenacious “proficient” teacher rating. In consultation with stakeholders, designers of the evaluation system could set preliminary targets for the number of teachers in each performance category and choose threshold values that would more closely reflect that distribution (see column 2 as an example).
Using a matrix to combine performance measures
Finally, many states have chosen to endorse a matrix to combine different types of performance measures. Though many view this type of rating matrix as more accessible for teachers, the design of these matrices has the potential to go very wrong. For example, one district I worked with had a matrix where teachers deemed “proficient” based on both classroom observations and student learning measures resulted in a “highly effective” rating overall; unsurprisingly, almost all teachers in that district were “highly effective.“ Another tendency is for matrices to round upwards when combining two equally weighted measures that may disagree – again, destroying the underlying variation in the performance measures themselves and bumping up all marginal performers to the next rating.
In my experience, I’ve found that a well-designed matrix can be nearly as good as any percentage model that directly applies weights to different types of performance measures (considered the superior practice, statistically speaking). Yet, states and districts should design them with caution as it is easy for a matrix to unintentionally throw the evaluation system off the rails in spite of how good the underlying teacher evaluations are.
Ultimately, efforts to improve the teacher workforce – whether through keeping the best or developing stronger teachers – all rely on a sound evaluation system to send the proper signals about teacher performance. I echo the criticism that academics have supplied ample research to the teacher evaluation problem, but significantly less design to help guide states how to execute well.
States now have the opportunity to reexamine their teacher evaluation systems under the newfound freedom provided under the Every Student Succeeds Act. As they do so, I urge them to think critically about all of the seemingly minor decisions inherent in their designs, and I urge academics not to shy away from the hairy details of design that helps bridge the gap between research and practice.


Commentary
Improving the design of teacher evaluation systems
March 17, 2016