As we approach the annual celebration of Dr. King’s life, it is worth examining the difference in how our schools discipline black and white children. In public schools in the United States, black children are twice as likely as white children to be subject to corporal punishment. Figure 1 shows the comparison, derived from nationwide data reported by schools to the Office of Civil Rights, Department of Education.[1] (All data is for the 2011-2012 school year, the latest year available.) The continuing disproportionate corporal punishment of black children is a reminder that some aspects of the “bad old days” are not fully behind us.
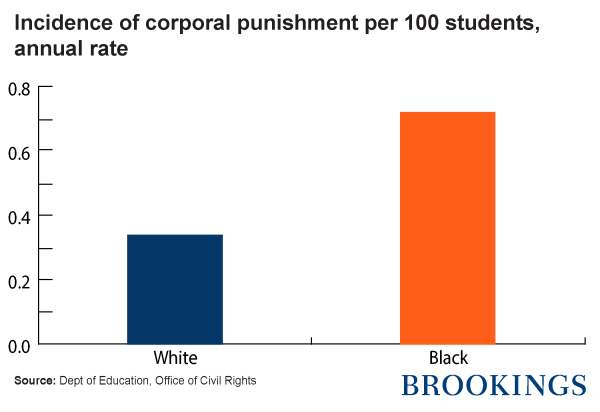
Figure 1
The 42,000 reported incidents of black boys being beaten, and 15,000 incidents for black girls, by educators in their school reflects two facts. First, black students are more likely to be located in states that use corporal punishment extensively. Second, in many states black students are disproportionately likely to be singled out for corporal punishment. Figure 2 shows the annual incidence of corporal punishment by state, with states where the incidence is less than once per ten thousand students greyed out.
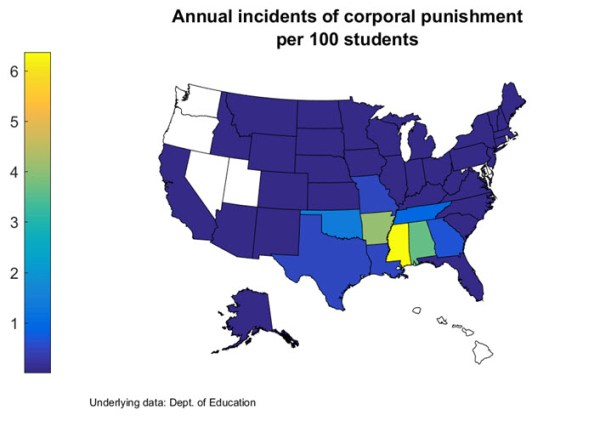
Figure 2
While corporal punishment is used in almost every state, seven states account for 80 percent of school corporal punishment in the United States: Mississippi, Texas, Alabama, Arkansas, Georgia, Tennessee, and Oklahoma. [2] For black students, six of these states (Mississippi, Alabama, Georgia, Arkansas, Texas, and Tennessee) plus Louisiana account for 90 percent of corporal punishment. One reason that black students are subject to more corporal punishment is that they live in those states responsible for most of the corporal punishment of all children.
Where is corporal punishment racially disproportionate? Essentially, and sadly unsurprisingly, the first answer is that black students are disproportionately beaten in parts of the Deep South. Black students are twice as likely to be struck as white students in North Carolina and Georgia, 70 percent more likely in Mississippi, 40 percent more likely in Louisiana, and 40 percent more likely in Arkansas. Figure 3 shows the ratio of the frequency of corporal punishment for black students compared to the frequency for white students, with states where the incidence is less than once per ten thousand students or where the rate is equal or lower for black students greyed out.
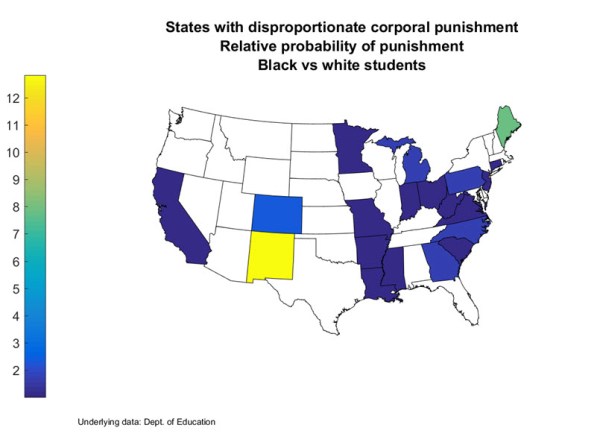
Figure 3
Some high corporal punishment states are not particularly racially disproportionate. Texas, notably, uses corporal punishment on black students and white with equal likelihood. Texas shows up on the lists of where black students are hit because it is a large state that administers corporal punishment at a moderately high rate. Alabama—where the rate of corporal punishment is 10 times the national average—also shows equal rates of black and white children experiencing physical violence from educators. In North Carolina, black students are twice as likely to be struck as white students, but North Carolina uses corporal punishment relatively infrequently and so accounts for a small proportion of punishment of black students. Notably, in South Carolina the rate of corporal punishment is below the national average and is not racially disproportionate.
While heavy use of corporal punishment is more common in states of the former Confederacy, racially disproportionate application happens in northern states as well. Schools in Pennsylvania and Michigan are nearly twice as likely to beat black children as white, although both have low overall rates of corporal punishment.
Perhaps most surprisingly, corporal punishment in Maine is wildly disproportionate—with black children being eight times as likely to be hurt as white children. Colorado, Ohio, and California also have rates of corporal punishment for black children that are 70 percent or more higher than for white children.
In Figure 4, I show rates of corporal punishment for white students on the horizontal axis and for black students on the vertical axis. States above the 45° line in Figure 2 have racially disproportionate corporal punishments. The states clustered at the lower left of the graph have relatively lower rates of corporal punishment, sometimes disproportionate and sometimes not.
Mississippi stands alone.
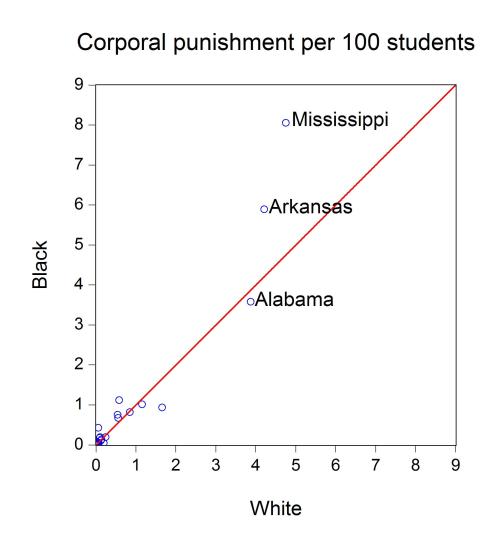
Figure 4
While the symbolism of continued physical violence against black children is inescapable, the disproportionate application of other forms of discipline may be of even greater concern. Except in Mississippi and Arkansas, the typical black student will probably not be subjected to corporal punishment during his school career. In contrast, school suspensions are much more common. Figure 5 shows rates of suspension by race.
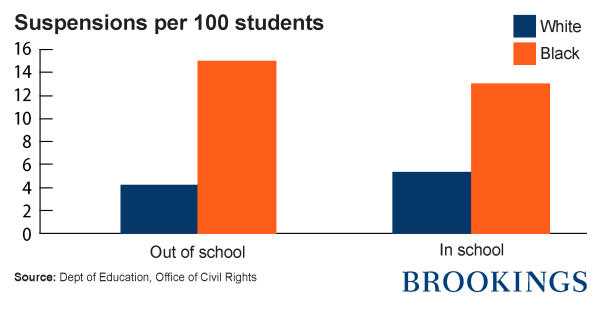
Figure 5
Note that an astounding 15 percent of black students receive an out-of-school suspension in a given year, a rate nearly 4 times that of white students; in-school suspensions are more than twice as likely among black students. Figure 5 shows out-of-school suspension rates for black and white students by state.
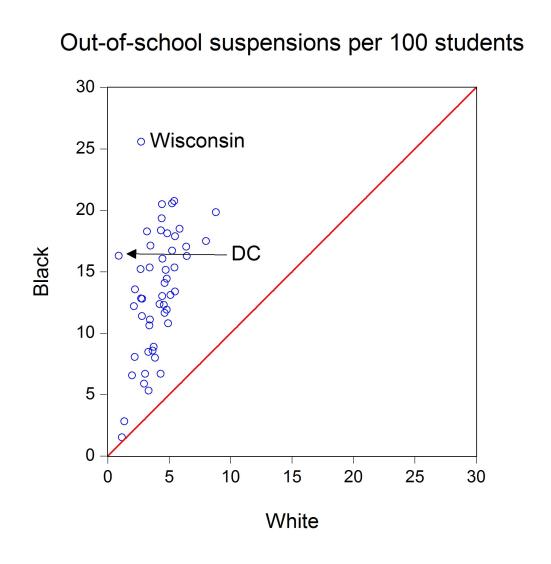
Figure 6
Out-of-school suspensions are applied disproportionately in every state—all points are above the red line. And these discipline patterns do not line up with old geographic patterns. The highest suspension rates for black students are in Wisconsin. And the greatest disparities (measured as the ratio of black-to-white suspension rates) are in the District of Columbia.
Every time a child is beaten in school and every time one is suspended and thus loses learning time, something or someone has failed that child along the way, regardless of the “reason” for the punishment. So long as these failures fall disproportionately on black children, we are not yet living up to the dream that “children will one day live in a nation where they will not be judged by the color of their skin but by the content of their character.”
Appendix
|
|
Discipline per 100 students |
|||
|
|
Corporal punishment |
Out-of-school suspension |
||
|
|
Black |
White |
Black |
White |
|
Alabama |
3.583033 |
3.869057 |
17.90929 |
5.468595 |
|
Alaska |
NA |
0.103160 |
8.592955 |
3.645956 |
|
Arizona |
0.029171 |
0.050941 |
12.32562 |
4.555046 |
|
Arkansas |
5.897032 |
4.205989 |
18.15124 |
4.832772 |
|
California |
0.051100 |
0.029146 |
14.44344 |
4.803916 |
|
Colorado |
0.057981 |
0.022656 |
11.12507 |
3.413624 |
|
Connecticut |
0.030811 |
0.025587 |
12.19697 |
2.117891 |
|
Delaware |
0.000000 |
0.000000 |
18.50083 |
5.836653 |
|
District of Columbia |
0.059520 |
0.000000 |
16.31737 |
0.872663 |
|
Florida |
0.197324 |
0.239999 |
19.85793 |
8.790211 |
|
Georgia |
1.125453 |
0.577535 |
16.07318 |
4.434872 |
|
Hawaii |
0.000000 |
0.000000 |
1.538462 |
1.145156 |
|
Idaho |
NA |
0.036444 |
5.891822 |
2.945636 |
|
Illinois |
0.031373 |
0.038082 |
15.35005 |
3.406990 |
|
Indiana |
0.063847 |
0.062103 |
20.57063 |
5.230889 |
|
Iowa |
0.022850 |
0.061744 |
15.22203 |
2.656221 |
|
Kansas |
0.011166 |
0.013882 |
12.80741 |
2.792517 |
|
Kentucky |
0.048563 |
0.190368 |
13.02577 |
4.424482 |
|
Louisiana |
0.759494 |
0.537434 |
13.41064 |
5.476110 |
|
Maine |
0.432043 |
0.057917 |
8.010801 |
3.839565 |
|
Maryland |
0.000000 |
NA |
8.901257 |
3.729914 |
|
Massachusetts |
0.004890 |
0.015254 |
10.63718 |
3.376658 |
|
Michigan |
0.179947 |
0.090549 |
20.77535 |
5.397792 |
|
Minnesota |
0.030967 |
0.028806 |
13.56956 |
2.204543 |
|
Mississippi |
8.059325 |
4.747161 |
15.36107 |
5.419384 |
|
Missouri |
0.683648 |
0.553408 |
20.52077 |
4.393734 |
|
Montana |
0.000000 |
0.043081 |
5.335968 |
3.311940 |
|
Nebraska |
0.019723 |
0.028463 |
18.29791 |
3.194068 |
|
Nevada |
0.000000 |
NA |
12.38813 |
4.214409 |
|
New Hampshire |
0.000000 |
0.051235 |
13.11094 |
5.099147 |
|
New Jersey |
0.018340 |
0.016058 |
11.39809 |
2.773110 |
|
New Mexico |
0.088313 |
0.007161 |
10.81837 |
4.902616 |
|
New York |
0.022768 |
0.031960 |
6.698778 |
3.031192 |
|
North Carolina |
0.045919 |
0.022889 |
16.71766 |
5.230456 |
|
North Dakota |
NA |
0.043300 |
2.846739 |
1.343501 |
|
Ohio |
0.054495 |
0.028990 |
18.37799 |
4.323960 |
|
Oklahoma |
0.937784 |
1.650464 |
15.15327 |
4.706784 |
|
Oregon |
0.000000 |
0.006020 |
11.93396 |
4.788382 |
|
Pennsylvania |
0.199160 |
0.099676 |
17.13759 |
3.469501 |
|
Rhode Island |
NA |
NA |
16.29604 |
6.434000 |
|
South Carolina |
0.021752 |
0.020802 |
17.06215 |
6.371353 |
|
South Dakota |
0.116550 |
0.121998 |
8.071096 |
2.184158 |
|
Tennessee |
1.020022 |
1.148149 |
19.35562 |
4.376236 |
|
Texas |
0.825640 |
0.843602 |
12.84153 |
2.717089 |
|
Utah |
NA |
0.004343 |
6.567593 |
1.978244 |
|
Vermont |
0.000000 |
0.030065 |
6.702997 |
4.289775 |
|
Virginia |
0.020342 |
0.017897 |
14.10793 |
4.615755 |
|
Washington |
NA |
0.001729 |
11.65880 |
4.614335 |
|
West Virginia |
0.143052 |
0.133395 |
17.50681 |
7.994511 |
|
Wisconsin |
0.010465 |
0.027360 |
25.60784 |
2.697800 |
|
Wyoming |
0.000000 |
0.016005 |
8.499234 |
3.295765 |
Discipline per 100 students is 100 times the ratio of discipline of a particular type reported for all students of a given race to the corresponding overall enrollment figures given by the Office of Civil Rights, for 2011-2012.
[1] The Office of Civil Rights collected data from all U.S. public schools. The data used here is aggregated to the state and national level by the Office of Civil Rights and can be found at http://ocrdata.ed.gov/StateNationalEstimations/Estimations_2011_12. Data is reported either directly by school districts or by states’ education agencies on behalf of the districts. Data on corporal punishment may count multiple incidents for a single student as multiple occurrences. According to the Office of Civil Rights, “Corporal punishment is paddling, spanking, or other forms of physical punishment imposed on a student.” Data for suspensions reports counts of students with multiple out-of-school suspensions as a single incident. Because all data is self-reported, it is not known whether all districts use the same standards in reporting.
[2] According to the Gundersen National Child Protection Training Center corporal punishment in schools is banned in most states. While most states do not permit corporal punishment in schools, they nonetheless report that schools beat children. Only Delaware and Hawaii report no corporal punishment. Corporal punishment is also rare in Maryland and Nevada, with fewer than three instances reported.


Commentary
Schools, black children, and corporal punishment
January 14, 2016