The U.S. Department of Education released new data this week on colleges’ cohort default rates (CDR)—reflecting the percentage of a college’s former students with federal student loans who entered repayment in Fiscal Year 2012 and defaulted by the end of Fiscal Year 2014. The average CDR dropped to 11.8 percent in Fiscal Year 2012, down from 13.7 percent in FY 2011 and 14.7 percent in FY 2010. Eight colleges had a CDR over 30 percent for three consecutive years, subjecting them to the loss of all federal financial aid dollars. Over 100 additional colleges had a CDR over 30 percent in the 2012 cohort, putting them at risk of losing funds if their performance does not improve.
Yet although CDRs are important for accountability purposes, they do not necessarily reflect whether students are repaying their loans. As of June 30, 2015, just over half of the $623 billion in Direct Loans made to students who have entered repayment are in current repayment. In addition to the $48 billion in loans in default, an additional $63 billion are more than 30 days delinquent and $180 billion are in deferment and forbearance. Deferment and forbearance are not always bad things, as students can qualify for either by being in the military or pursuing graduate studies. However, students can also request deferment and forbearance for economic hardship, while interest still accrues. The presence of income-based repayment plans, in which students making below 150 percent of the federal poverty line can make no payments while still remaining current on their loan, further complicates any analyses. All of these complications make cohort default rates a weak metric of whether students are actually paying back their loans.
Are students repaying their loans? A look using College Scorecard data
The Department of Education’s recent release of College Scorecard data provides new insights into whether students are repaying their loans, while also allowing for comparisons to be made to the current CDR metric. The Scorecard contains a new measure of the percentage of students whose student loan balance was lower than when entering repayment, which reflects the percentage of students who have been able to pay down at least some principal.
Using this new metric on declining student loan balances to compare with colleges’ CDRs, I come to three new findings. Please note that for the purposes of this blog post, I consider the three-year cohort default rate for students who entered repayment in FY 2011 compared to the one-year and three-year repayment rates for students who entered repayment in FY 2010 and 2011. The key findings are below.
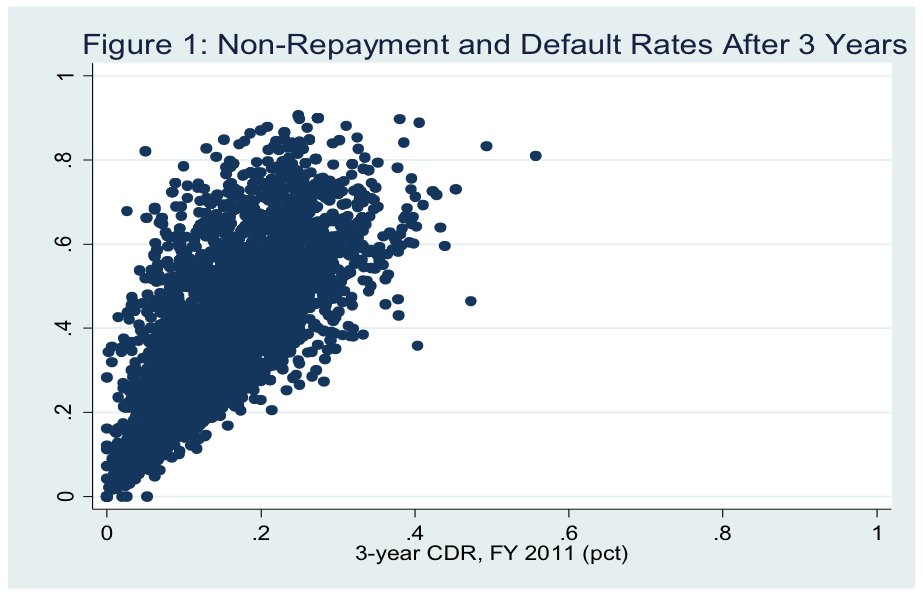
(1) Cohort default rates substantially underestimate the percent of students who have been unable to lower their loan balances. Of the nearly 5,700 colleges with data on both CDRs and repayment rates, the median college had a 14.9 percent three-year CDR while 40.8 percent of students did not repay any principal in the first three years after leaving college. This means that one in four exiting students was not in default, yet did not make a dent in their loan balance in the first three years after entering repayment. Figure 1 below shows the relationship between CDRs and repayment rates. A low CDR for a college is associated with higher rates of repayment (with a correlation coefficient of 0.76), but there are plenty of exceptions. For example, 25 percent of the colleges with default rates below 10% had more than one-fourth of all students failing to repay any principal.
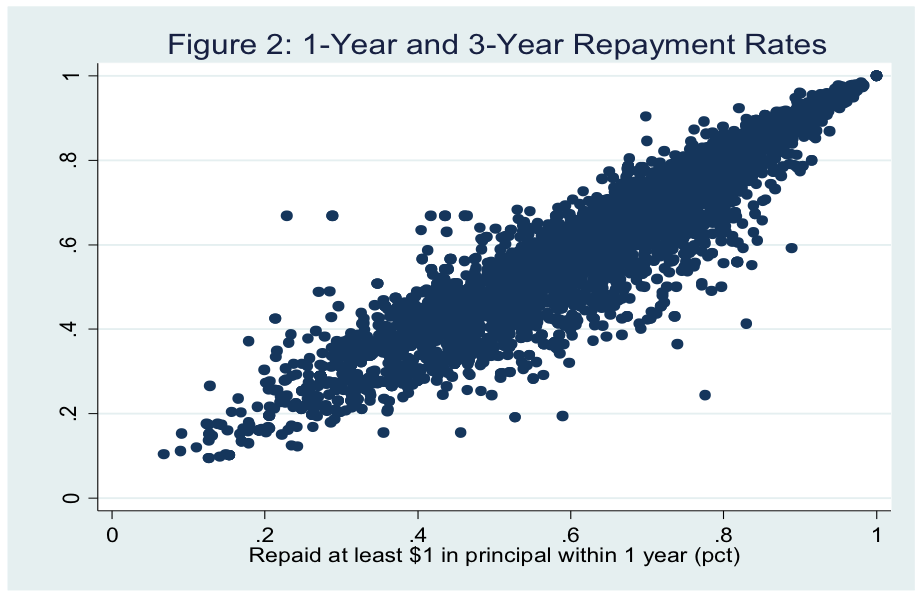
(2) The percentage of students paying down principal doesn’t change much between one year and three years since entering repayment. One year after entering repayment, 62.8 percent of students at the median college had paid down at least $1 in principal, though that percentage dipped slightly to 59.2 percent within three years (see Figure 2 for the distribution of repayment rates). This drop is likely due to some students either falling behind on their payments while enrolled in the standard repayment plan as well as payments under income-based plans being insufficient to cover accumulating interest. In either case, stagnant or falling repayment rates should raise red flags regarding students’ ability to eventually pay off the loan within 10-20 years.
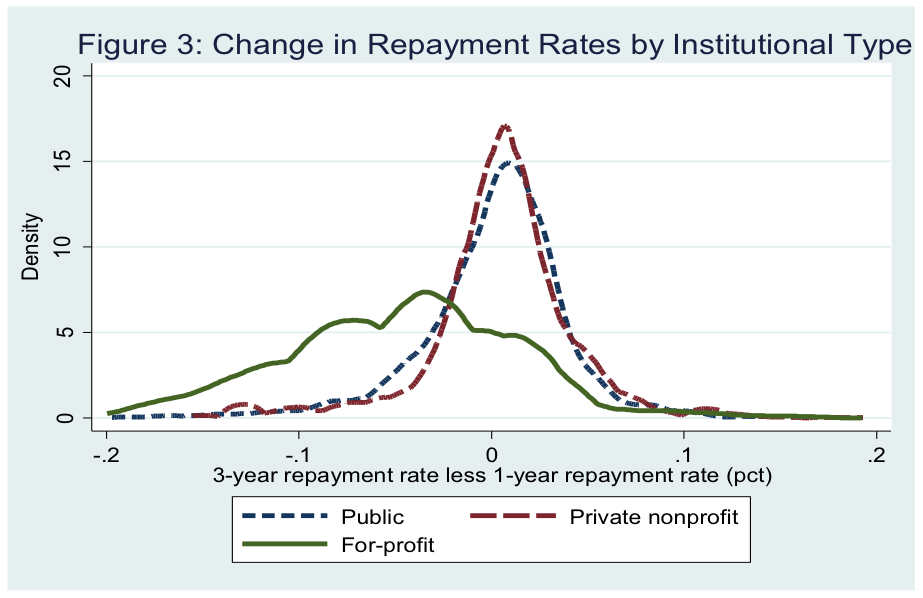
(3) As a whole, repayment outcomes make a turn for the worse at for-profit colleges compared with public or private nonprofit colleges. This can be best illustrated by showing the difference in repayment rates between one and three years of entering repayment by institutional type. As Figure 3 below shows, for-profit colleges tended to have lower repayment rates after three years than one year, a red flag that their borrowers are not doing well, while public and private nonprofit colleges saw similar repayment rates over time. Only one in four for-profit colleges had more students paying down principal three years after completion, which points to potential problems for students and taxpayers alike. Although for-profit colleges have somewhat lower CDRs than community colleges, community colleges do not see drops in the repayment rates that exist in the for-profit sector.
The new loan repayment rate data provides an additional tool for policymakers to use when holding colleges accountable for their performance. Although this metric represents a substantial improvement over CDRs by including students who are struggling to make payments, the presence of income-based repayment plans (where students can stay current on their loans by making small payments if their income is sufficiently low) complicates any accountability efforts. Further research is needed to examine the implications of income-based repayment programs on principal repayment rates.


Commentary
How well do default rates reflect student loan repayment?
September 30, 2015