In this edition of Charts of the Week, some data on economic performance and the labor market.
Deficits ARE “baked into” the federal budget

To separate the effects of public policy from the state of the economy on government deficits, economists and analysts look at “full employment” deficits showing what the imbalance between spending and revenues would be if the economy were at full employment. In the chart, William Gale shows full-employment deficits from 1965 to the present, and then projects them going forward. This projection, Gale says, “indicates a fundamental imbalance between spending and taxes that is now ‘baked into’ the federal budget.”
NON-COMPETE CONTRACTS BECOMING MORE WIDESPREAD
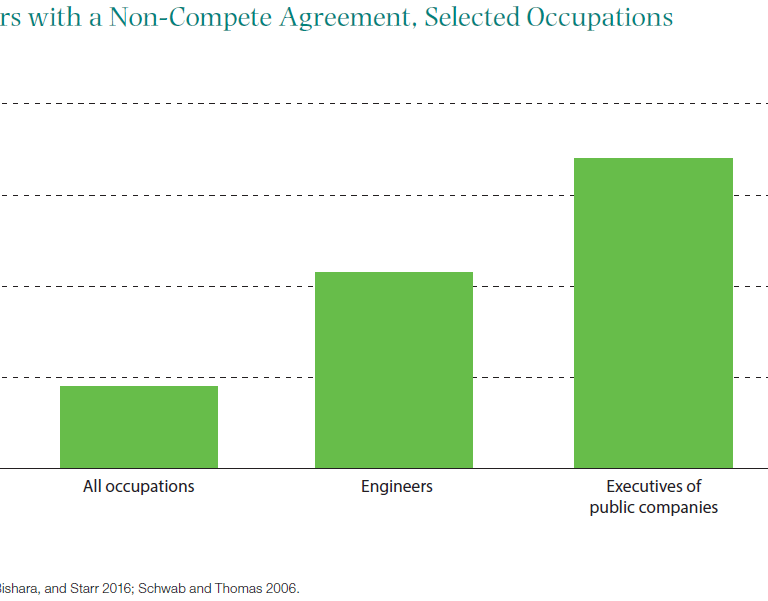
Non-compete contracts—wherein an employee agrees to not pursue, start, or trade in a similar profession in competition with the employer—are becoming more widespread in the labor market, even outside the executive class. Ryan Nunn observes that “nearly one fifth of workers have a non-compete on their current job, with substantially higher fractions reporting having had a non-compete in certain specific occupations.” Nunn offers some policy options to address some of the problems associated with these arrangements, and argues that “for low-wage workers in particular, the case for allowing non-competes is weak, and efforts to eliminate those NCAs are supported by the best research currently available.”
Fiscal policy is boosting economic growth

The Hutchins Center’s Fiscal Impact Measure shows the positive or negative contribution of local, state, and federal tax and spending policies on GDP growth. Now updated for the fourth quarter of 2019, the Hutchins Center notes that “Fiscal policy has been boosting economic growth modestly for several quarters, and the FIM is now near its highest values since 2010, when the American Reinvestment and Recovery Act was supporting the economy. Looking forward, tax and spending policies at all levels of government are expected to be slightly contractionary in 2020 and 2021.”
The chart above is static, so be sure to visit the FIM interactive page to see total impact, but also broken down by federal, state, and local spending on goods and services, and taxes and benefit programs.
Authors

Commentary
Charts of the Week: Deficits, labor, fiscal policy
February 7, 2020