Ranking U.S. metro areas, or counties, or even countries, by some fixed metric is a straightforward and often useful way to start a deeper dive into a larger body of research. For example, the top 10 counties by share of taxpayers claiming EITC, or the top 10 metro areas by change in prosperity. But what if the phenomenon being measured is more complex, has interacting characteristics that make a top 10 list less useful?
In new research, Brookings Senior Fellow Alan Berube, along with his colleagues at the Metropolitan Policy Program, and John Irons of the Rockefeller Foundation, ask “What makes an economy inclusive?” Inclusive economies, they say, “expand opportunities for more broadly shared prosperity, especially for those facing the greatest barriers to advancing their well-being.” A new Rockefeller Foundation framework identifies five characteristics of inclusive economies: equity, participation, stability, sustainability, and growth.
A typical ranking approach would list the top 10 inclusive economies (or the bottom 10) based on some score derived from data. It turns out, however, that understanding the “trends and relationships that might reveal the ‘big picture’ of what makes an economy inclusive” doesn’t lend itself to typical ranking techniques, and instead requires looking at relationships among the characteristics to ascertain that “big picture.”
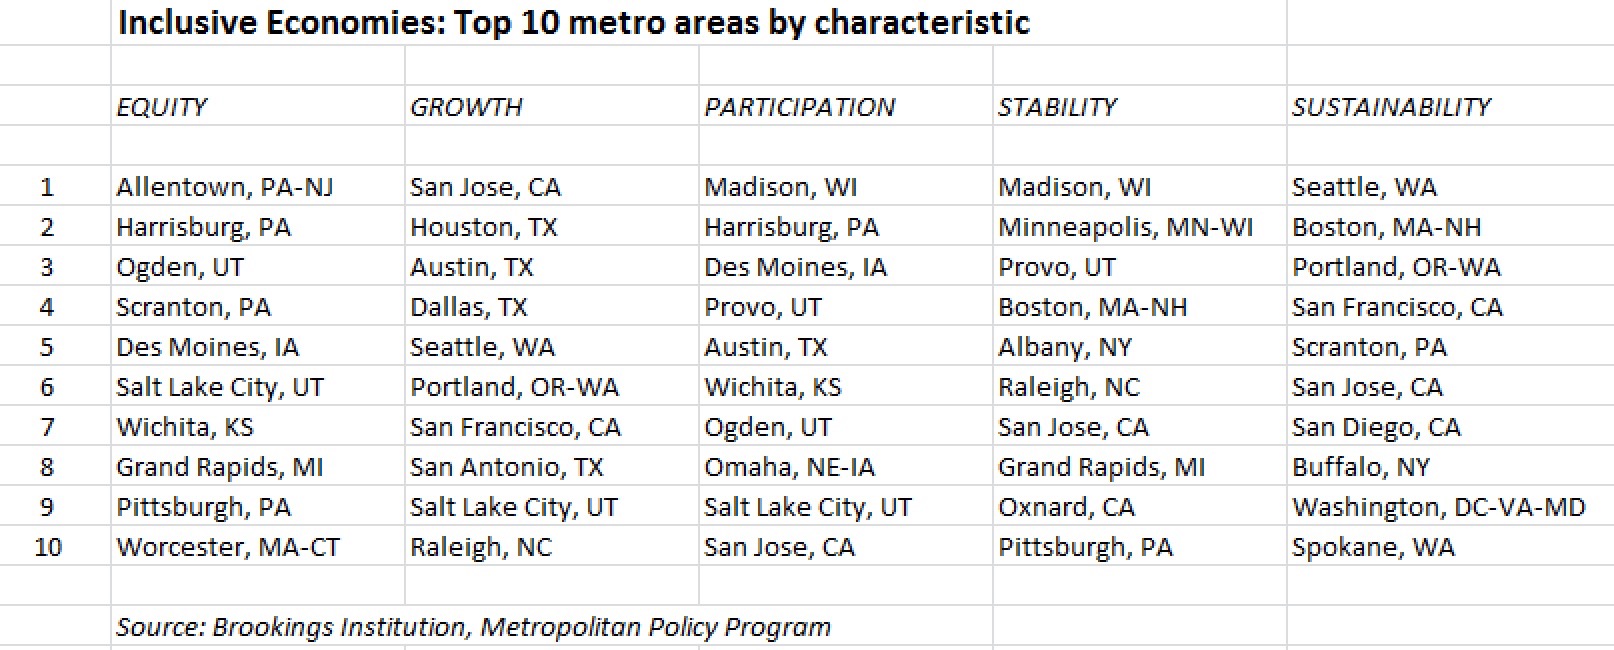
Take, for example, equity, defined as: “More opportunities are available to enable upward mobility for more people.” For this analysis, Brookings researchers used 16 discrete indicators—such as the Gini coefficient, median income of less-educated workers as a share of overall median income, and transportation costs as a share of income—to come up with an equity score for each of the 100 largest U.S. metro areas. (Likewise, each of the other four inclusive economy indicators are composites of many discrete indicators, for a total of about 100 across the five.) Looking at equity alone, the top 10 metro areas are:
- Allentown, PA-NJ
- Harrisburg, PA
- Ogden, UT
- Scranton, PA
- Des Moines, IA
- Salt Lake City, UT
- Wichita, KS
- Grand Rapids, MI
- Pittsburgh, PA
- Worcester, MA-CT
Top 10 lists can also be fashioned for the other four dimensions in the inclusive economies research, each showing a different mix of U.S. metro areas. For example, the top three metro areas in the growth characteristic are San Jose, CA; Houston, TX; and Austin, TX. For participation: Madison, WI; Harrisburg, PA; and Des Moines. Stability: Madison; Minneapolis, MN-WI; and Provo, UT. And, sustainability: Seattle; Boston; and Portland, OR-WA. In fact, 30 different metropolitan areas are present in the combination of the five inclusive top 10 lists, spanning the country from Oxnard, to Omaha, to Raleigh. The individual top 10 lists for each inclusive economy characteristic look like this:
Because these rankings each impart useful and distinctive information about metro economies, Brookings researchers next combined the data into an overall ranking of the 100 metro areas “based on their average rankings on individual indicators for each of the five inclusive economy characteristics.” Instead of generating a ranking from 1 to 100, the analysis produces a grid-like chart that shows how metro areas fare not only in terms of inclusiveness (top to bottom), but also along a left-to-right spectrum that demonstrates the trade-offs between growth and equity. Here’s a sample from the chart (visit and study the chart here; note that wealth is depicted but by itself is not part of the inclusive economy score):
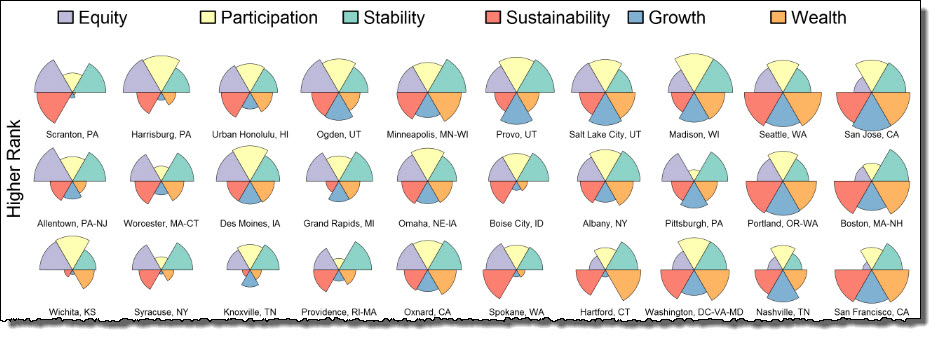
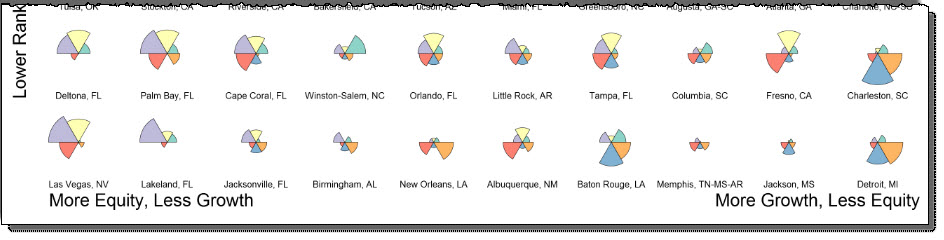
One thing that stands out when considering this colorful chart against the disaggregated top 10 lists is how unrelated they seem to be. San Jose sits at the upper right position of the chart, suggesting that it ranks as one of the most inclusive metro economies, and yet it ranks only 51st on equity. By contrast, Allentown, PA—on the left of the second row—ranked first in equity, but lower on other measures. However, taken as a whole, both Allentown and San Jose are in the top 20 metro areas overall for inclusiveness. Detroit sits along the bottom row of the inclusiveness chart. Among the five characteristics, it posts its highest rank in growth (37th overall), with much lower ranks in the other categories, even though it ranks 29th for wealth. Las Vegas, NV, is one of the least wealthy metro areas (91st), but ranks 19th in terms of equity.
Berube and Irons point to what they call “a few important insights” about the chart and these data:
- Judged across all five characteristics, the “most” and “least” inclusive metro economies are geographically and economically diverse.
- More equitable metropolitan economies also exhibit higher levels of participation and stability.
- Growth and equity vary independently across metropolitan areas.
- Metro areas with similar performance across the five characteristics may not possess the same capacity to improve their performance.
For more detailed discussion, and the complete inclusive economies chart, see “Measuring ‘inclusive economies’ in metropolitan America,” by John Irons and Alan Berube.
See also “A metro map of inclusive economies,” showing metro areas that are similar to others in these outcomes.
Finally, download detailed information on the composition of the 100 indicators used to measure the five inclusive economies indicators.


Commentary
U.S. metros ranked by the 5 characteristics of inclusive economies
June 10, 2016