In a new report and interactive, Adie Tomer and Joseph Kane of the Metropolitan Policy Program analyze domestic and international goods trade data from 2010, arriving at a number of key conclusions and policy recommendations. Among them, more than 80 percent of all goods start or end in the nation’s 100 largest metro areas; just 10 percent of the nation’s trade corridors move more 79 percent of all goods; and every region of the country relies on major network hubs to move large volumes of goods nationally and globally. Whether by ship, rail, truck, or train, Tomer and Kane argue that “With over 77 percent of the nation’s freight moving between different states, the United States must establish a more coordinated freight strategy across all levels of the public and private sectors.”
The paper and data are accompanied by two very cool interactives that you can use to find out what commodities your city is trading to other cities domestically and globally. One shows trade flows among the 75 largest domestic markets and 25 largest global markets. The second shows the largest trade flows between over 400 U.S. metros/regions and each other plus the world. I had a lot of fun with this second one.
I noticed that Abilene, Tex. is the first city in the list, and since that happens to be the place of my birth, I decided to dive in to the interactive and learn more. Here is what I found about my place of birth’s role in regional, national, and global trade—and also how to use this interactive feature.
Pick your geography
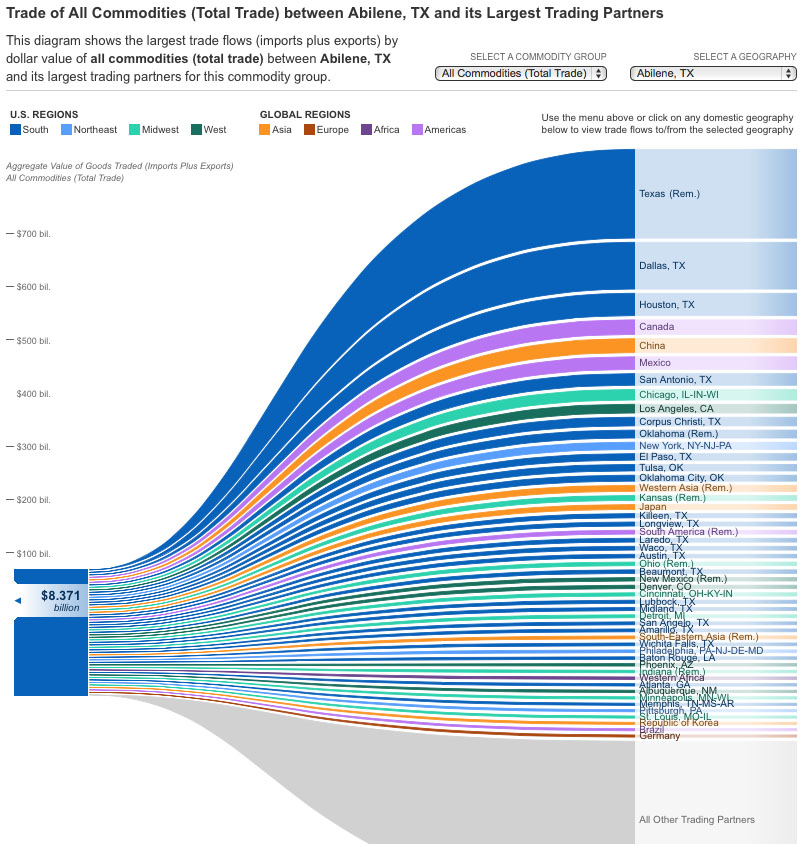
Conveniently, Abilene, TX, is first on the list. It’s a small city in west central Texas of just over 117,000 residents. For total trade of all commodities, it has a lot of trading partners, with all of Texas minus the larger metros first, then Dallas, then Houston. But see, Canada and China are fourth and fifth, ahead of Mexico! The aggregate value of goods traded from Abilene is shown on the left at over $8.3 billion.
Value of trade with one location
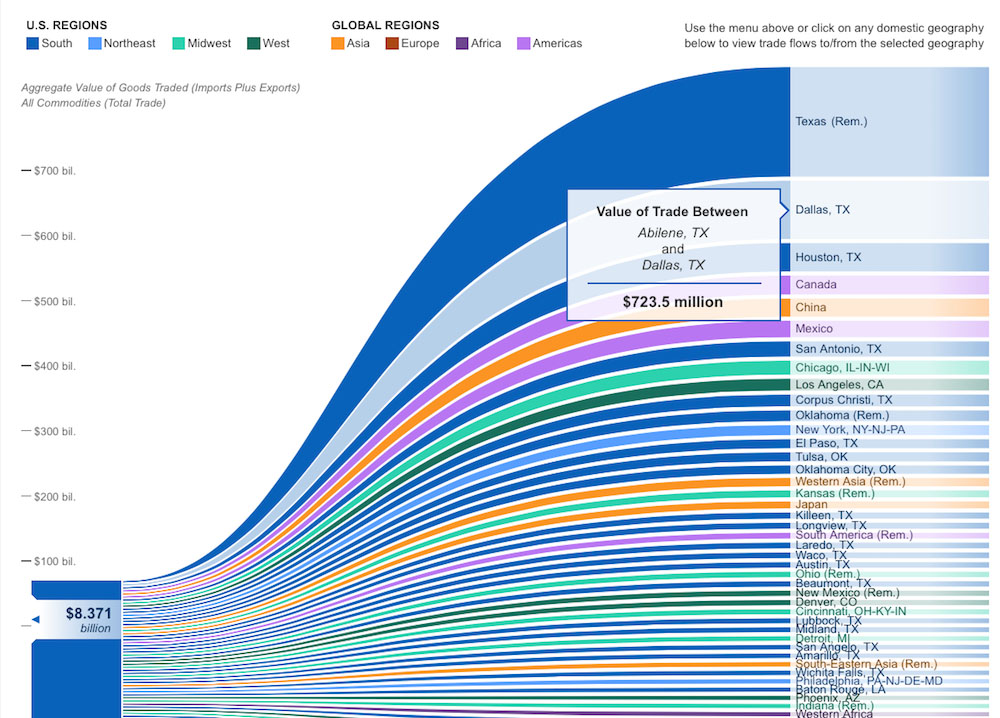
Abilene’s top single destination for its trade is the city where I grew up, Dallas. Hover over the bar for Dallas and you’ll see the dollar amount: $723.5 million between the two locations. That’s just about 9 percent of Abilene’s total trade.
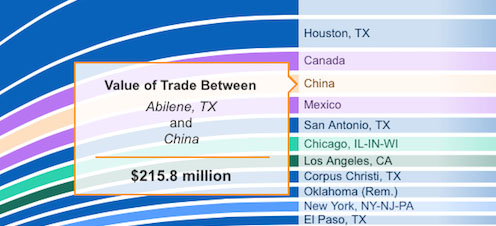
And then there is Abilene’s trade with China. Very interesting. Just hover over “China” and you’ll learn that the value of trade between the two places is nearly $216 billion, about 2.5 percent of Abilene’s trade. Again, Abilene is trading with a large number of places, so no one place will own a very large share.
Pick a specific commodity
I was intrigued by Abilene’s trading story now, but so far had looked only at its total trade, for all commodities. The interactive has 16 specific commodities to choose from in a drop down menu next to the geography:
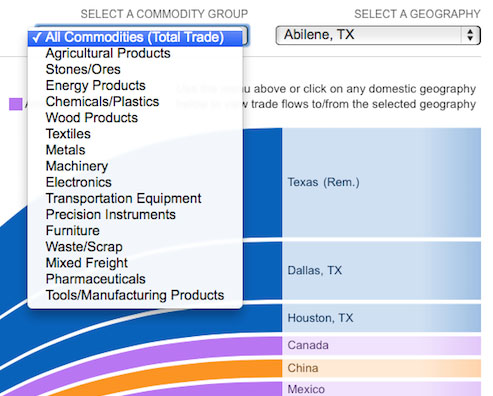
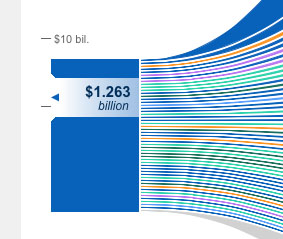
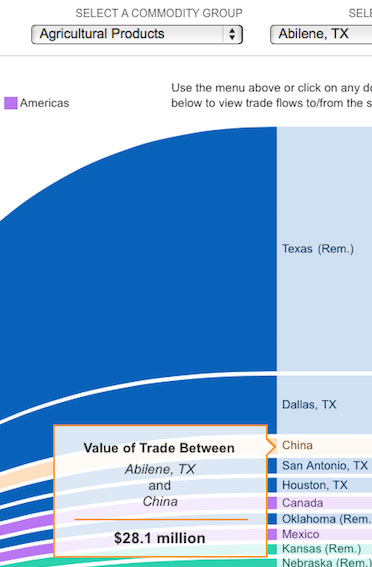
So, I chose the first option, agricultural products. I made an assumption that Abilene, being located on the fertile plains, might trade in agricultural products. So, I picked that and watched the chart reassemble itself to show just this one commodity and trade of it between Abilene and all the other places. First thing I noticed is that the aggregate value of this commodity is $1.263 billion, so agricultural products are 15 percent of all of Abilene’s trade.
But look at what happens with China: after all of Texas-minus-the-largest-metros, and minus Dallas, China is Abilene’s largest trading partner for ag products, at $28.1 million, or about 2 percent of all of its agricultural product trade.
Find out which commodity is tops
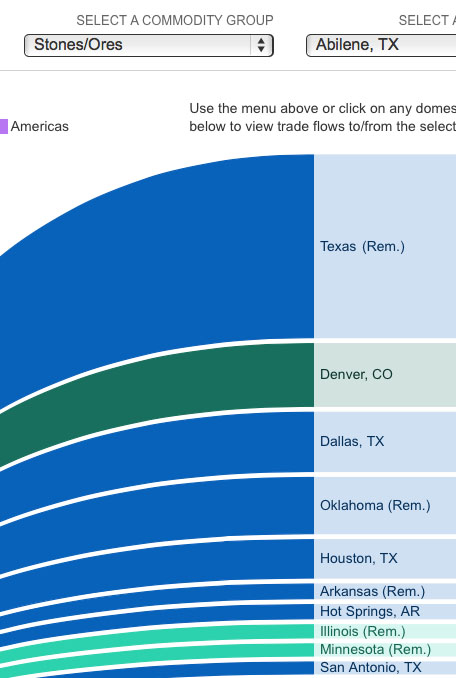
This led me to wonder, for which commodity does Abilene have the most trade with China? It wasn’t stones and ores; China is far down the list, and the Texas city doesn’t do a lot of trade in this commodity anyway ($31.5 million).
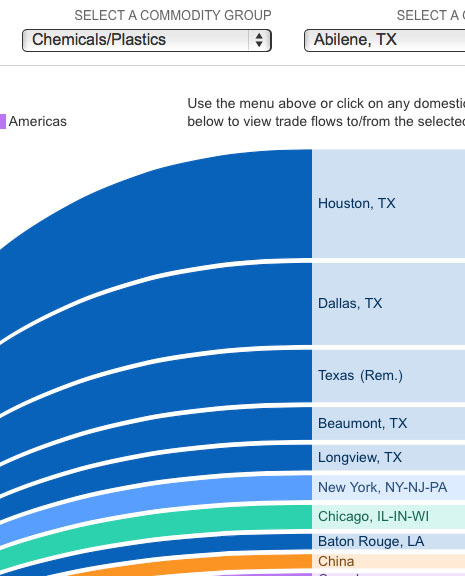
It wasn’t chemicals/plastics, either, but I noticed Longview, TX in the geography list for the first time. My grandmother lived in that east Texas town when I was young and I remember the pungent smell of chemicals in the air from the Eastman chemical plant there; it made chemicals for Kodak film.
Finding Abilene’s top commodity traded with China
Which commodity would put China on top? It was really easy to use the menu to select each one and watch the colored, wavy bars reassemble themselves (the colors represent the different U.S. and global regions, so at a glance you can see regional groupings).
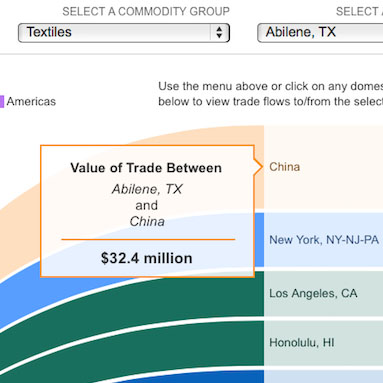
First hit: Textiles. Abilene’s number one trading partner in textiles is China. Interestingly, Dallas falls to seventh on this list.
Abilene’s total textile trade is small, though, about 3 percent of its aggregate trade.
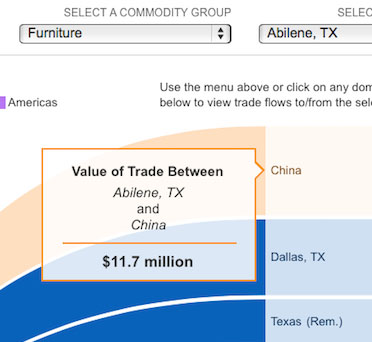
Moving down the list, furniture is also a commodity in which China is Abilene’s top partner, though at about a third the value of textiles.
And finally, China is Abilene’s top trading partner in waste/scrap, but at an even lower value than the other two, $5 million.
It turns out that Abilene’s most traded commodity with China is textiles (and Abilene’s most traded commodity overall is energy products, at nearly 30 percent of its total, followed by agricultural products, electronics, chemicals/plastics, and mixed freight).
Switch to another geography
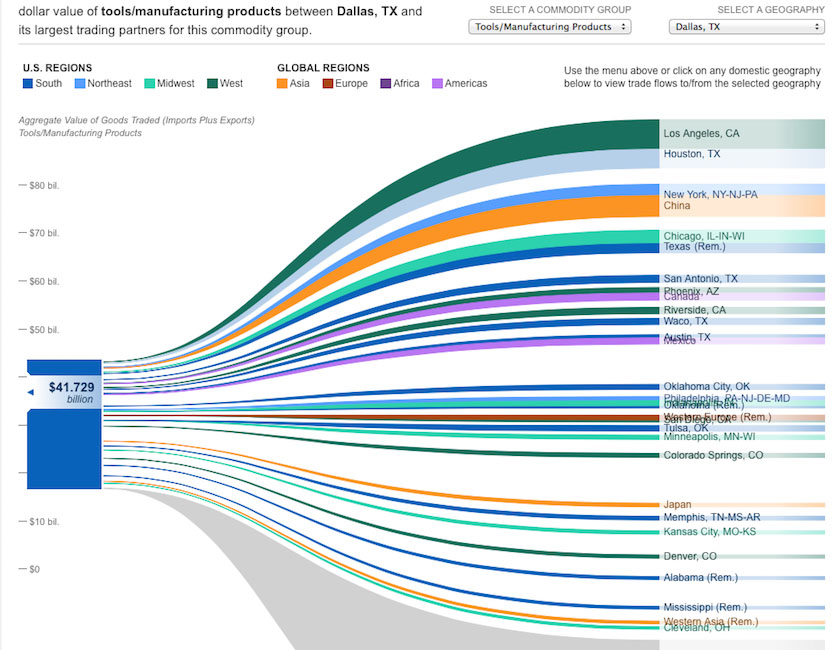
I mined Abilene for all it was worth in this interactive. Time to explore somewhere else. And it is as easy as clicking on the city/region name in the right column in any one of the views for a commodity. I had tools/manufacturing products already selected for Abilene (a commodity representing 6.5 percent of Abilene’s total trade), then clicked on Dallas from the top of the list of trading partners, and voilà, the entire chart rearranged itself to make Dallas the selected geography, and displayed its value of tools and manufacturing products traded at over $41.7 billion, five times Abilene’s total trade, and showed Los Angeles, CA as the top trading partner for that commodity. One last thing: when you switch from a specific commodity group to all commodities for a metro the size of Dallas, the aggregate value scale on the left side changes by a factor of ten.
As I hope you can tell, I enjoyed using this chart to learn a little more about the place of my birth even though I only lived there for about two years before my family moved to Dallas.
No matter where you are from or live now—Waco, Honolulu, Kalamazoo, Philadelphia, or somewhere in-between—use the interactive to explore what your town trades and who it trades with. The geography options are only for the U.S., though. Use the first chart mentioned above to explore trade flows for countries in addition to the largest U.S. metros. It’s really cool, too.
Also, visit the bio pages of both Tomer and Kane to get more of their research on metro freight.
Related Books
Authors


Commentary
Use This Interactive to Find Out Where Your City Is Trading
November 7, 2014