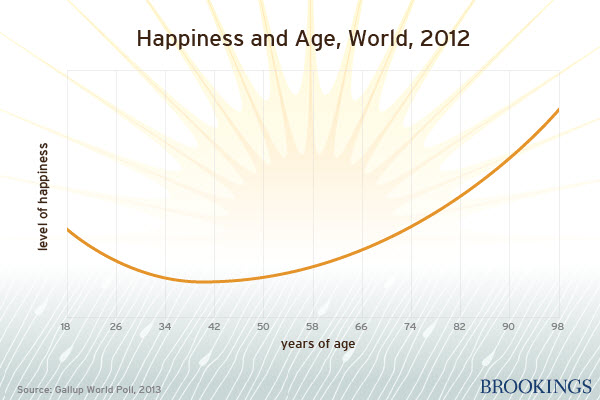
In “Why Aging and Working Makes us Happy in 4 Charts,” Carol Graham describes a research paper in which she and co-author Milena Nikolova examine determinants of subjective well-being beyond traditional income measures. One of these is the relationship between age and happiness, a chart of which resembles, remarkably, a smile.
As Graham notes:
There is a U-shaped curve, with the low point in happiness being at roughly age 40 around the world, with some modest differences across countries. It seems that our veneration of (or for some of us, nostalgia, for) youth as the happiest times of our lives is overblown, the middle age years are, well, as expected, and then things get better as we age, as long as we are reasonably healthy (age-adjusted) and in a stable partnership.
The new post has three additional charts that showcase other ways to think about factors of happiness.
Graham, the author of
The Pursuit of Happiness: An Economy of Well-Being
, appeared in a new
Brookings Cafeteria Podcast
.


Commentary
This Happiness & Age Chart Will Leave You With a Smile (Literally)
March 28, 2014