Ben Harris presents data on “Variation in EITC Take-up, County by County.” The Earned Income Tax Credit, a tax credit for low- and moderate-income workers, is, according to Harris, “one of our nation’s most effective anti-poverty policies, bringing 10.1 million families out of poverty in 2012.”
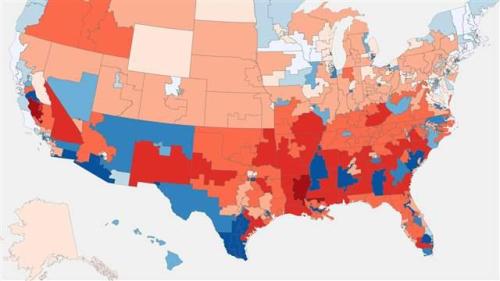
Harris, a fellow in Economic Studies and policy director of The Hamilton Project, uses IRS data from 2007 to show “notable variation across counties in EITC take-up.” The “median county sees 16.2 percent of taxpayers claiming the EITC.” He describes the regional variation as “stark”:
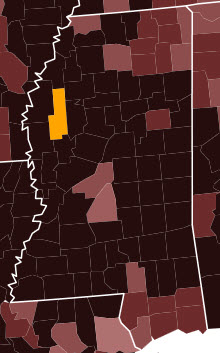
The counties with the highest share of taxpayers taking up the EITC are overwhelming located in the Southeast. As can be seen in the accompanying map, a large share of counties in Alabama, Georgia, and Mississippi have over half of their taxpayers claiming the EITC. With few exceptions, almost all counties with high rates of EITC take-up are located in the South. Relative to the South, the Northeast and the Midwest have much lower rates of EITC take-up. Moreover, average EITC benefit closely follows the pattern for share of taxpayers taking up the credit.
The ten counties with the highest share of taxpayers claiming EITC are listed below. Populations are 2012 estimates from the Census Bureau. The counties are shown in yellow on the maps, and are derived from the EITC interactive map, where you can also get county-level average EITC amounts.
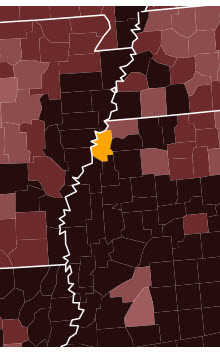
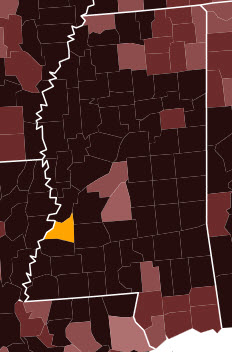
10. Sunflower Co., MS
EITC Share: 46.8% Pop.: 28,431 County Seat: Indianola
The B.B. King Museum and Delta Interpretive Center is located in Indianola.
|
|
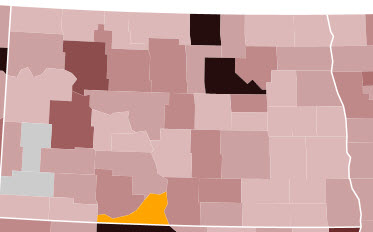
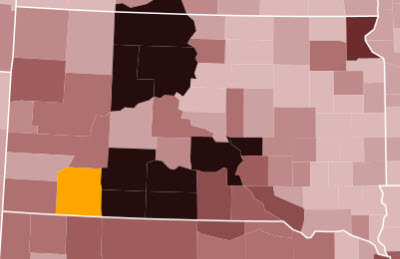
9. Sioux Co., ND
EITC Share: 47.1% Pop.: 4,347 County Seat: Fort Yates
The Standing Rock Sioux Reservation encompasses this county entirely.
|
 |
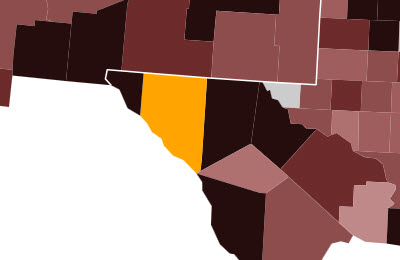
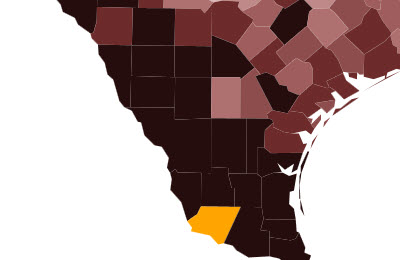
8. Hudspeth Co., TX
EITC Share: 47.4% Pop.: 3,337 County Seat: Sierra Blanca
In 1880, Apaches killed seven “Buffalo Soldiers” of the Tenth U.S. Cavalry here.
|
 |
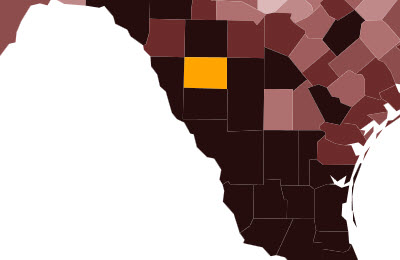
7. Zavala Co., TX
EITC Share: 47.9% Pop.: 11,961 County Seat: Crystal City
The county is named for Lorenzo de Zavala (1788-1836), a Mexican politician who signed the Texas Declaration of Independence in 1836 and briefly served as vice president of the interim government.
|
 |
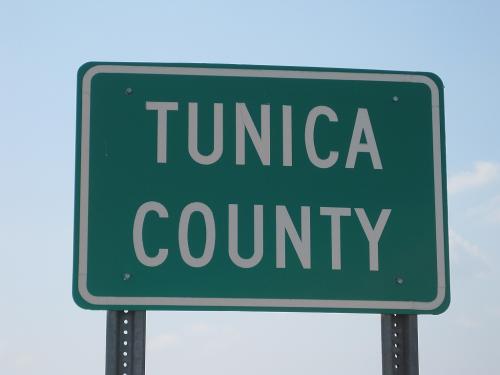
6. Tunica Co., MS
EITC Share: 48.0% Pop.: 10,475 County Seat: Tunica
According to the American Gaming Association, Tunica and environs host the nation’s 10th largest casino market by annual revenue (2012).
|
 |
5. Starr Co., TX
EITC Share: 48.9% Pop.: 61,615 County Seat: Rio Grande City
In 1988, voters in Starr County gave Michael Dukakis 84.7% of their vote, the Democratic candidate’s highest county total (Zavala Co. was second). In 2012, President Obama won 86.4% of the vote there.
|
 |
4. Claiborne Co., MS
EITC Share: 49.6% Pop.: 9.349 County Seat: Port Gibson
Port Gibson is home to the oldest surviving synagogue in the state, Temple Gemiluth Chassed, built in 1892. The now-vanished Jewish congregation was founded by Ashkenazi immigrants from Alsace-Lorraine.
|
 |
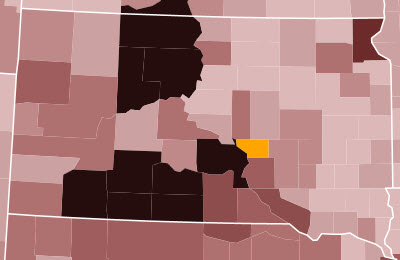
3. Todd Co., SD
EITC Share: 52.5% Pop.: 9,942 County Seat: none
The county lies entirely in the Rosebud Indian Reservation, where live the Sicangu Lakota, or Rosebud Sioux.
|
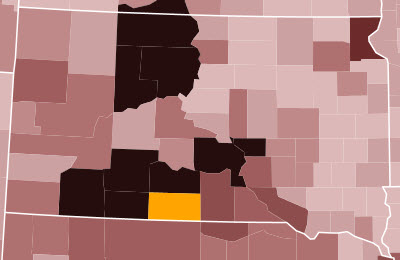 |
2. Shannon Co., SD
EITC Share: 52.9% Pop.: 14,059 County Seat: none
Like Todd Co., Shannon Co. is located entirely within an Indian reservation, Pine Ridge. On December 29, 1890, members of the U.S. 7th Cavalry killed over 300 men, women and children in what has become known as the Wounded Knee Massacre.
|
 |
1. Buffalo Co., SD
EITC Share: 59.7% Pop.: 2,020 County Seat: Gann Valley
The Fort Thompson Mounds are located on the Crow Creek Indian Reservation here, and show evidence of the first pottery-making peoples in the area. The mounds date from ca. 800.
|
 |
Get more research on the EITC on our topic page and also from the Metropolitan Policy Program.
N.b.: EITC data are from Ben Harris; information about the counties are from the blog post author. Mingwei Ma contributed to this post.
Related Books


Related Content

Authors


Commentary
Top 10 Counties by Share of Taxpayers Claiming EITC
February 5, 2014