As part of a series of regional reports on cities, the U.N. Habitat program recently released its 2018 report on African cities. The report, entitled, “The State of African Cities 2018—the geography of African investment,” provides an overview of foreign direct investment (FDI) in Africa and its impact on African cities.
The report’s section on Chinese investment in Africa in particular highlights the growing number of African FDI recipients and the increasing diversification of investment to include non-resource sectors of the economy. Over the 2003-2014 period, flows of Chinese FDI into Africa increased significantly, peaking in 2008 and stabilizing over the 2011-2014 period (Figure 1). During this time, China’s FDI stock in Africa rose from $491 million to $32.4 billion. FDI stock measures the total amount of investment at the end of a given period whereas flows measure investment within a range of time, which is one year in the case of this report.
Figure 1: China’s FDI flows into Africa (2003-2014)

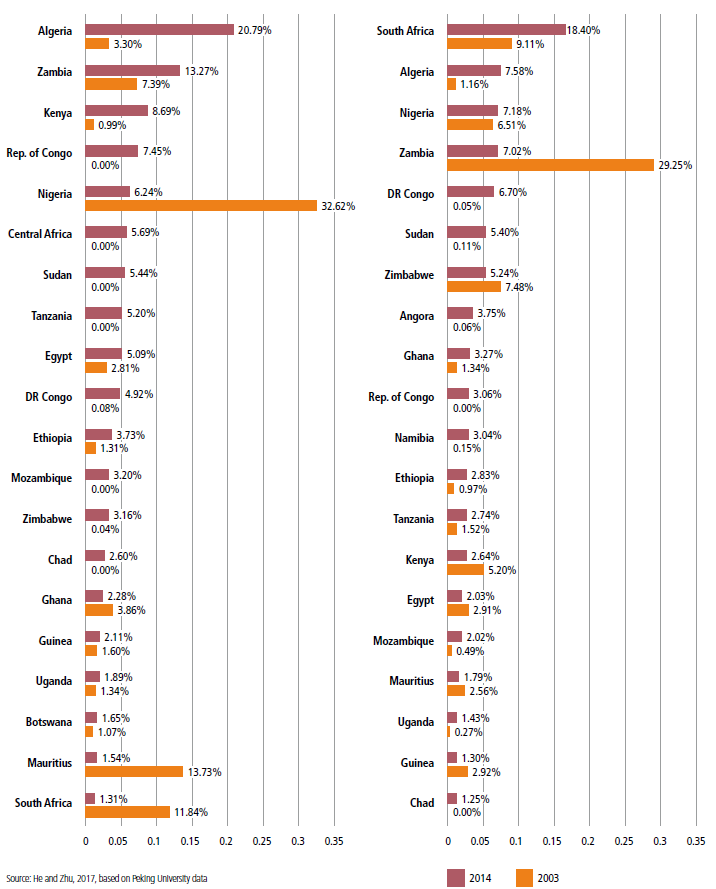
Not only did the overall amounts of FDI flows from China increase over that period, but so did the number of African country recipients, as panel (a) in Figure 2 shows. Notably, in 2014, a significantly lower share of Chinese FDI was directed towards established investment markets like Mauritius, Nigeria, and South Africa.
In 2014, 50 percent of China’s FDI stock in Africa was located in only six countries, with South Africa having the largest share at 18 percent (Figure 2, panel b). Interestingly, the other five countries—Algeria, Nigeria, Zambia, Democratic Republic of the Congo, and Sudan—are all resource-rich countries. The report attributes this trend to Chinese central government state-owned enterprises’ (SOEs) focus on the petroleum and non-ferrous metals sectors.
Figure 2: Top 20 African destinations of China’s FDI flows (a) and stocks (b)
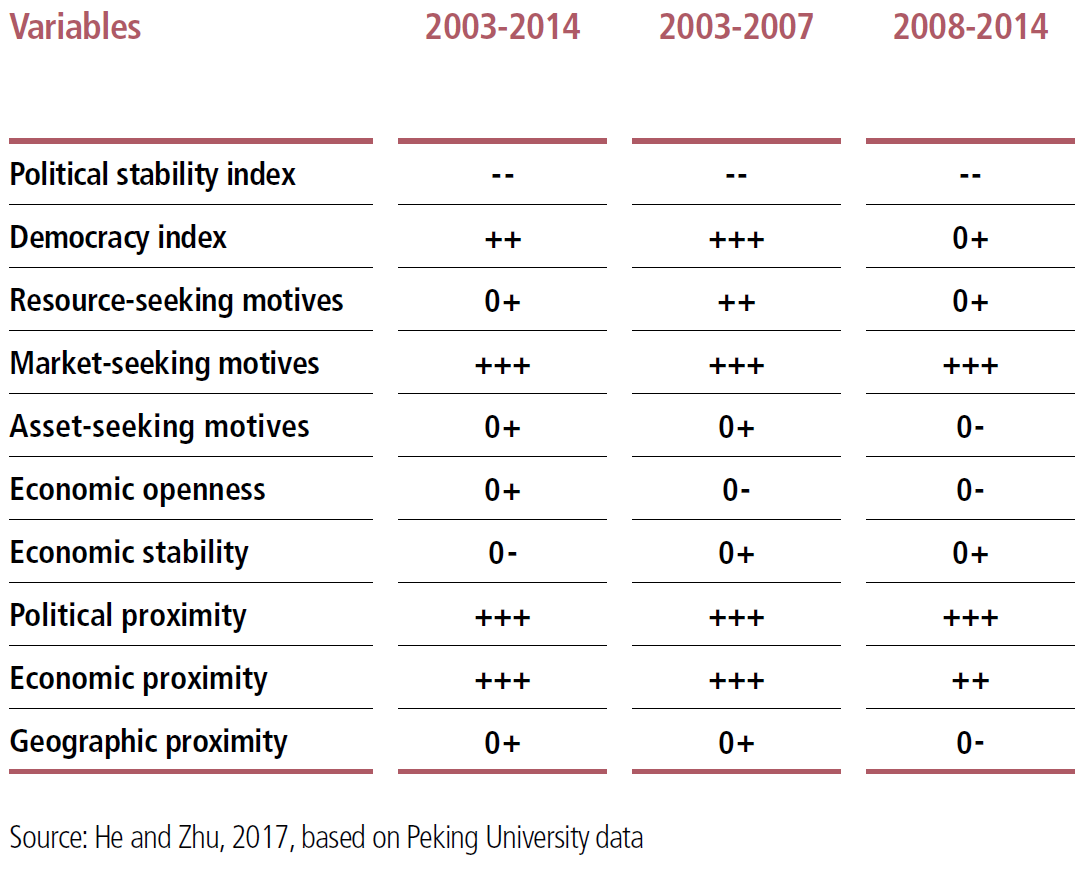
In their analysis of the determinants of Chinese FDI in Africa, the authors find that investment was higher in less politically stable countries (Table 1). The authors propose several explanations for this trend. First, Chinese FDI might be higher in less politically stable countries because the Chinese government maintains a strong influence in investment decisions by the SOEs, and those countries host fewer competitors from advanced-economy foreign investors. They also find that greater political proximity, as measured by scores assigned to diplomatic events between China and African governments, led to higher FDI inflows.
In contrast to criticism that China is only investing in Africa for its natural resources, the authors find the trend more nuanced. Splitting the sample into two periods, 2003-2007 and 2008-2014, the authors find a positive relationship between Chinese investment and a country’s resource abundance during the 2003-2007 period, but this relationship is not significant in the later one. One likely explanation is that the share of Chinese FDI from non-SOEs, which are less resource oriented, increased during the 2008-2014 period, making Chinese FDI less resource seeking.
Table 1. The determinants of Chinese FDI in Africa
Authors


Commentary
Figures of the week: Trends and determinants in Chinese FDI in Africa
July 25, 2018