The Global Innovation Index (GII)—a tool co-published by Cornell University, INSEAD, and the World Intellectual Property Organization (WIPO)—recently released its 2018 report on the theme “Energizing the World with Innovation.” The index measures the innovation performance of 126 countries around the world using 80 indicators that represent seven key pillars of innovation: 1) institutions, 2) human capital and research, 3) infrastructure, 4) market sophistication, 5) business sophistication, 6) knowledge and technology outputs, and 7) creative outputs. Pillars one through five are categorized as “innovation inputs”—the components of economic and political systems that affect innovation—whereas pillars six and seven are considered “innovation outputs” or the results of innovative activities. The index scores range from 0 to 100.
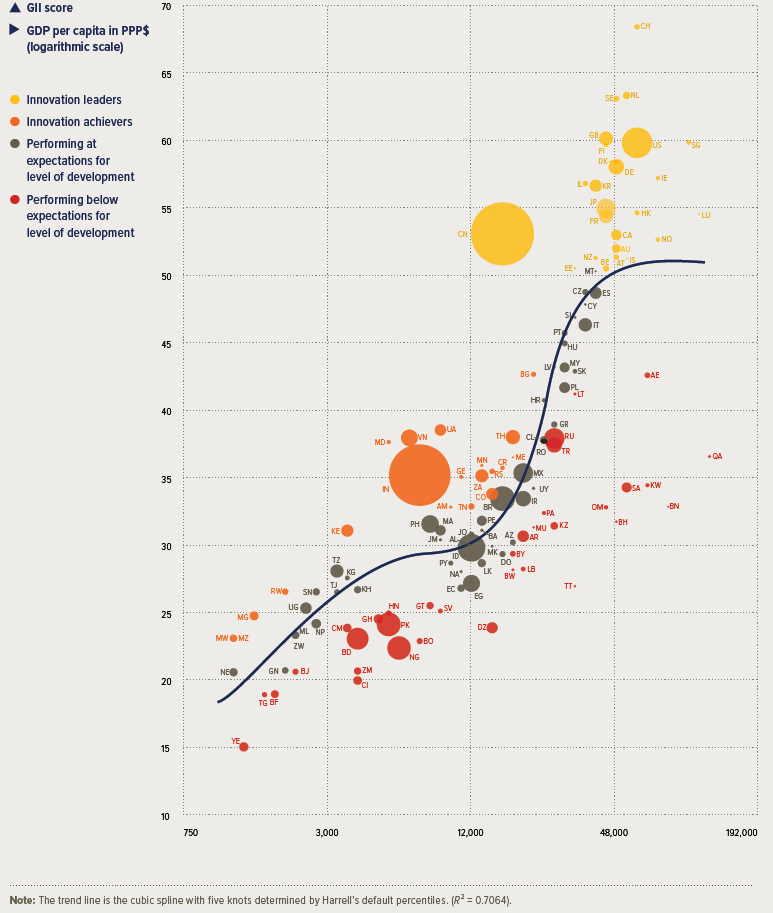
The latest report indicates that although sub-Saharan Africa has the lowest regional average GII score at 25, it also has more countries among the group of “innovation achievers” than any other region—six out of 20 total achievers. Innovation achievers are countries that surpass their expected level of innovation performance, based on their levels of development (in terms of GDP per capita in PPP$), estimated using a trend line curve extrapolated from the data.[1] In particular, Kenya, Rwanda, Mozambique, Malawi, and Madagascar received special recognition for appearing in the innovation achievers group at least three times in the previous eight years (see Table 1 and Figure 1). The region’s top scoring countries in terms of overall innovation performance were South Africa (ranked 58 of 126 countries with a score of 35.15), Mauritius (ranked 75 with a score of 31.31), and Kenya (ranked 78 with a score of 31.07). Despite these successes, 16 sub-Saharan African countries still fell among the bottom 25 performers.
Table 1. Innovation achievers: Income group, region, and years as an innovation achiever
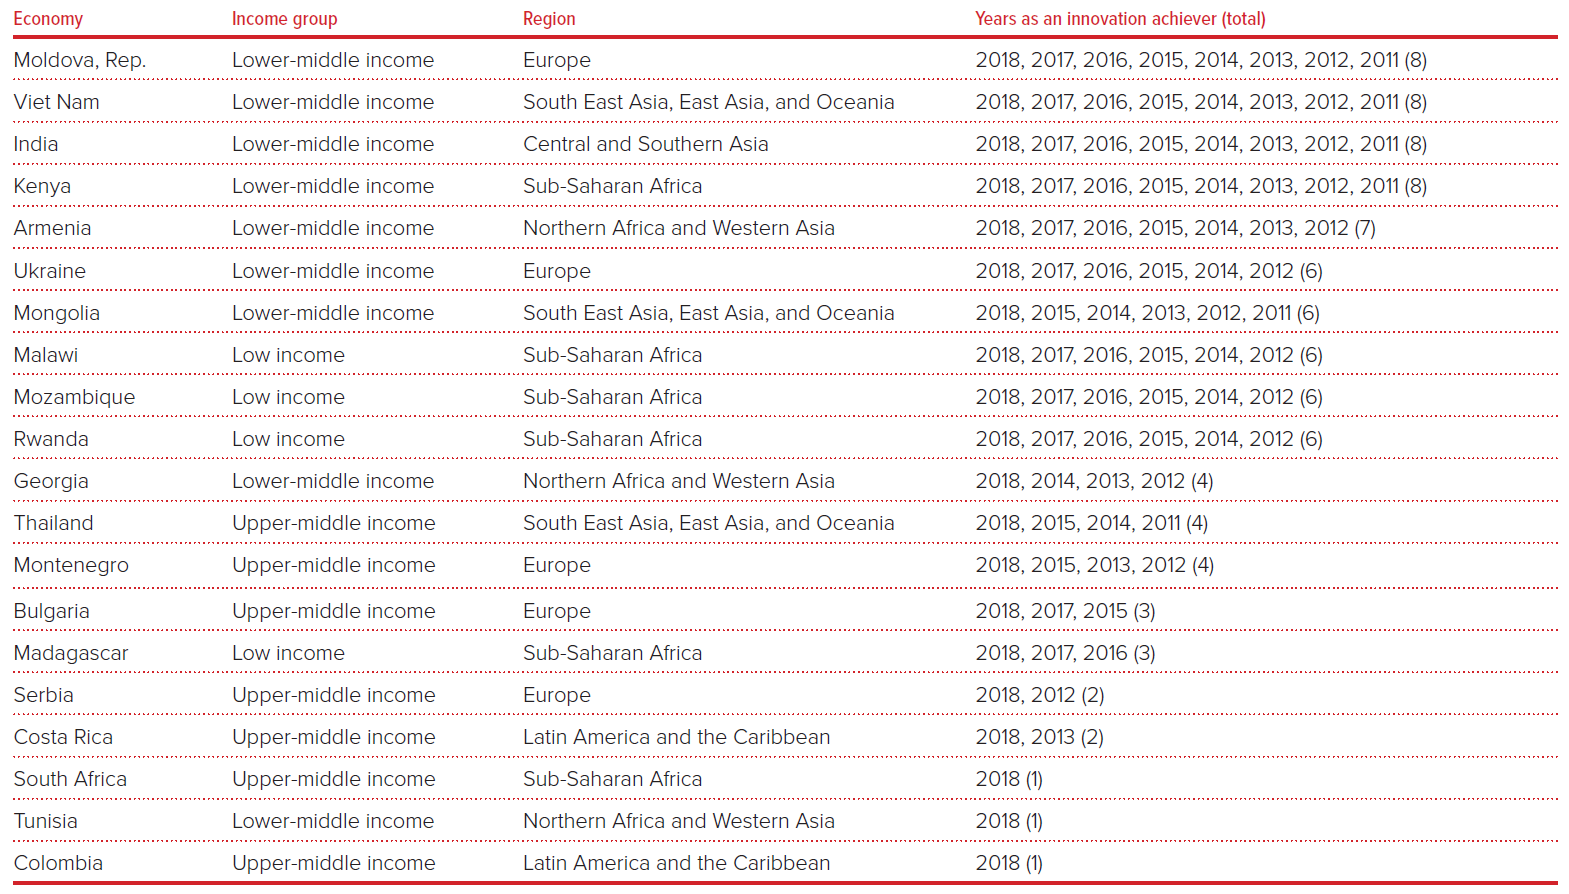
Figure 1: GII scores and GDP per capita in PPP$ (bubbles sized by population)
Diving into the special topic of energy innovation, the report noted that several countries in Africa, including Côte d’Ivoire, Ghana, Rwanda, and Tanzania, are making notable progress in implementing off-grid renewable energy programs to create distributed, as opposed to centralized, energy systems. In Rwanda, local governments and private companies are collaborating to establish widespread off-grid solar energy systems to provide electricity to approximately 600,000 households in remote areas. Innovations in pay-as-you-go business models and processing payments via mobile phones are helping to expand opportunities for Rwandan consumers to access affordable electricity. At the same time, the authors highlighted grassroots innovations in several communities related to the use of wood fuel in sub-Saharan Africa, such as briquetting technology and improved biomass cooking systems. These grassroots innovations developed by community members and researchers provide practical, context-specific solutions to local problems, the authors argue.
The report concludes that in some developing countries, especially where institutions and regulations related to conventional energy sources have yet to be implemented, the adoption of energy innovations can allow countries to leapfrog to new, more efficient systems for energy production, storage, distribution, and consumption. To realize these energy innovations, as well as innovations in other sectors, however, countries need to intensify investments and enact reforms in the institutions, human capital, infrastructure, markets, and business environments that support the innovation landscape.
end note
[1] The GII innovation achievers trend line curve is constructed from a cubic spline with five knots calculated using Harrell’s default percentiles. For more information, see note 64 on page 52 in the report.
Authors


Commentary
Figures of the week: Africa’s energy innovation landscape
July 20, 2018