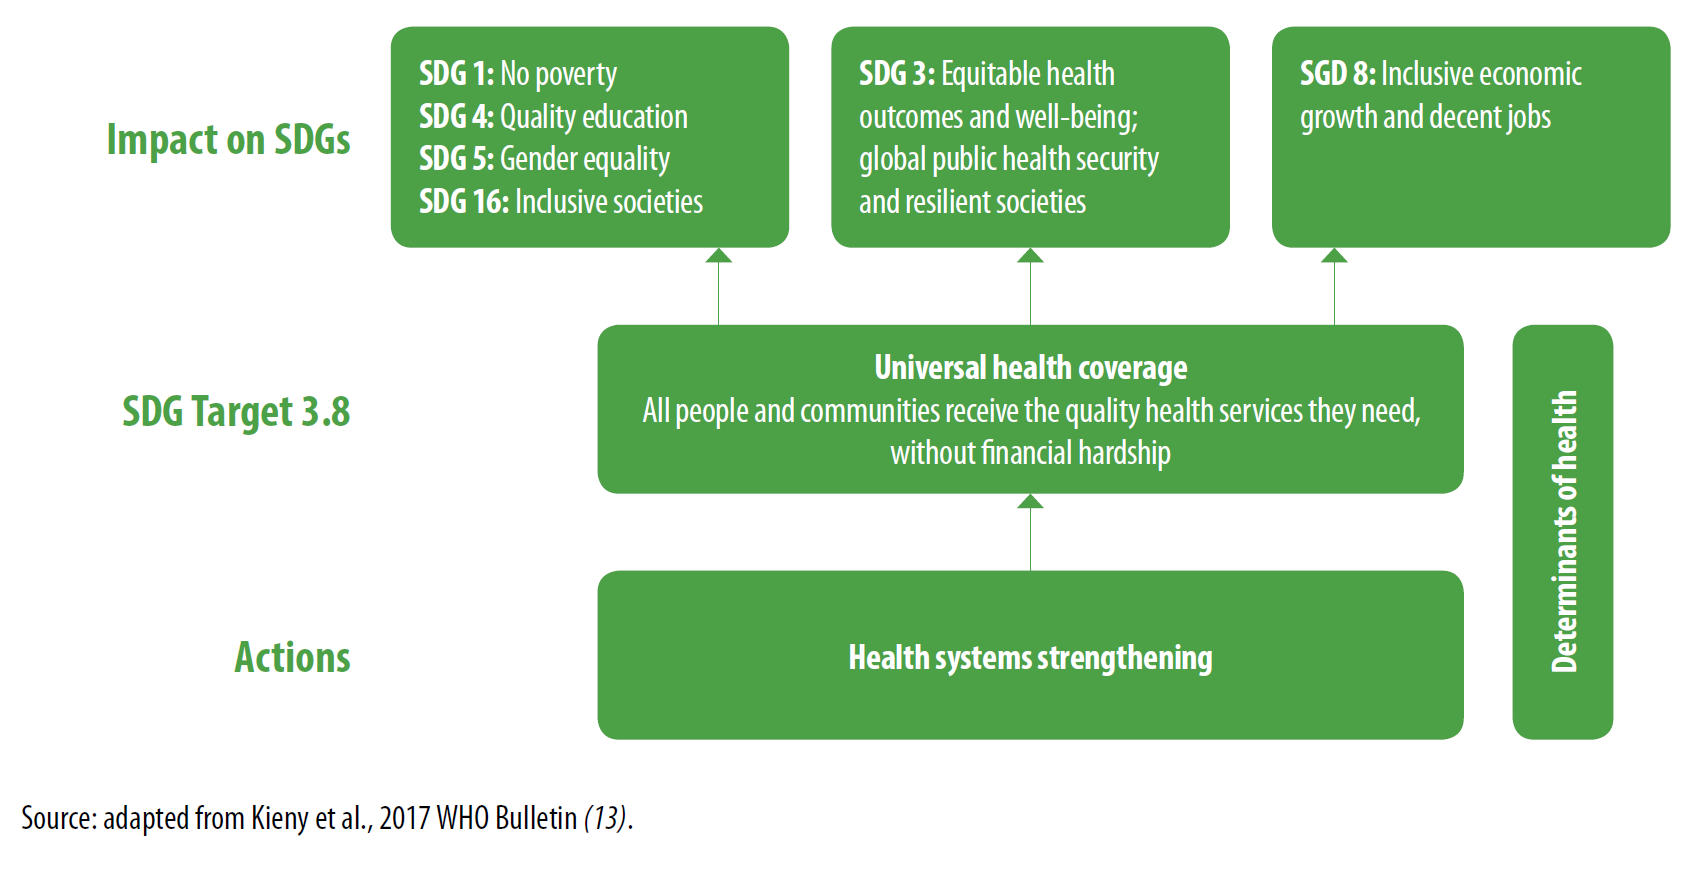
The United Nations’ Sustainable Development Goal (SDG) 3 recognizes the importance of promoting people’s health and well-being to sustainable development (see Figure 1). However, ensuring quality health care coverage for people—without having them suffer financial hardship due to out-of-pocket expenses—remains a major challenge in many countries worldwide. To support positive health outcomes, Target 3.8 of SDG 3 calls on countries to “achieve universal health coverage, including financial risk protection, access to quality essential health care services and access to safe, effective, quality and affordable essential medicines and vaccines for all.” As countries strive to realize SDG 3, monitoring progress of Target 3.8 at the national, regional, and global levels will be important to understanding policy and implementation gaps, as well as increasing accountability of the SDG process.
Figure 1. Investing in health systems to reach universal health care coverage and the SDGs
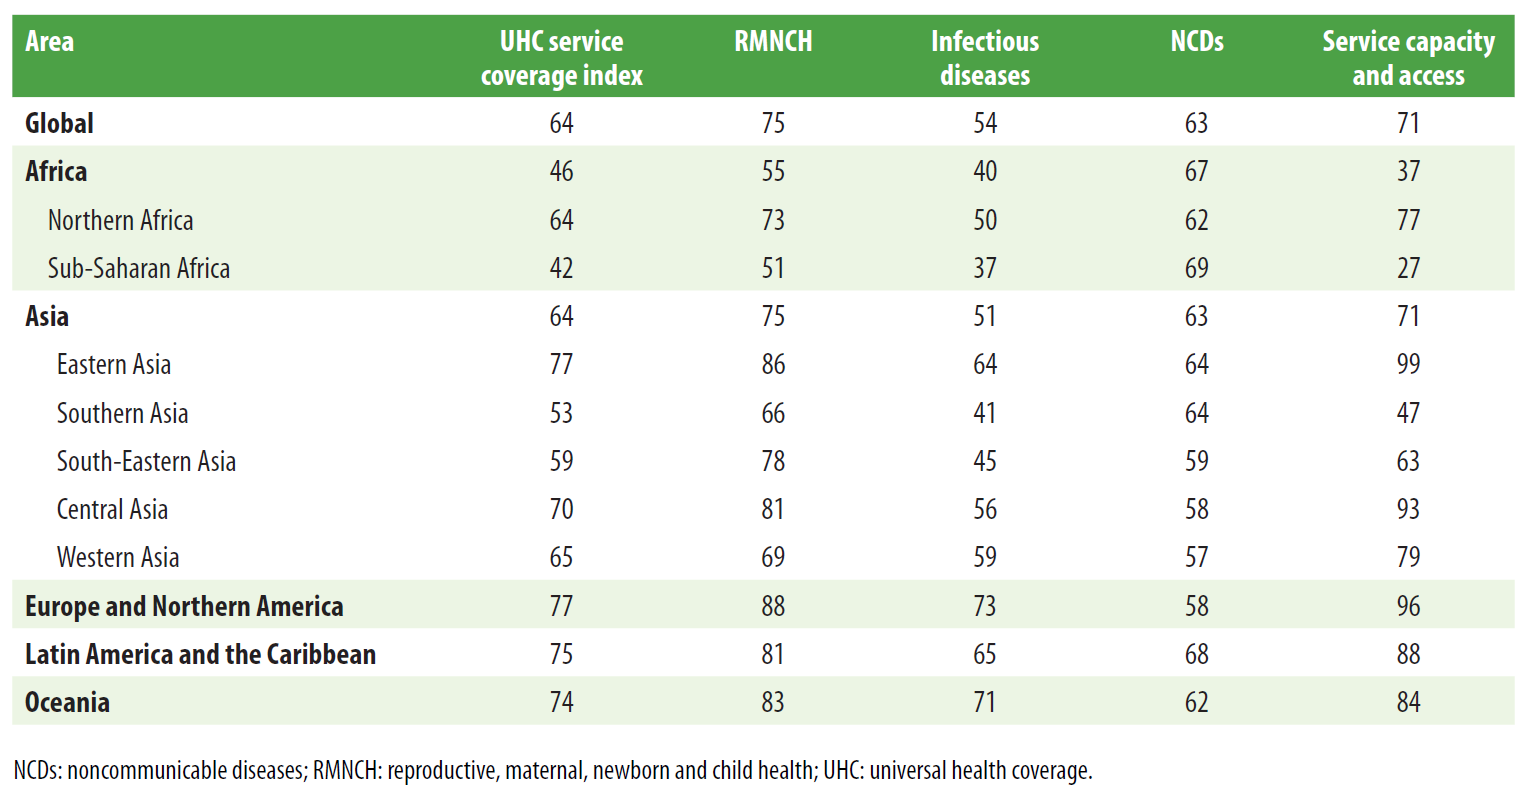
In a recent joint World Bank and World Health Organization report, Tracking Universal Health Coverage: 2017 Global Monitoring Report, the authors examine regional and national efforts to meet SDG 3 by ensuring universal health care coverage (UHC) and financial risk protection. Figure 2 uses country-level “UHC service coverage index” scores to show the relative performance of countries worldwide in achieving universal health care coverage. The service coverage index scores are computed from sixteen tracer indicators of essential health service coverage, which fall into four main categories: reproductive, maternal, newborn, and child health (RMNCH), infectious diseases, noncommunicable diseases (NCDs), and service capacity and access. Notably, sub-Saharan Africa has the lowest UHC service coverage index score of any region (42 out of 100), followed by Southern Asia (53), while East Asia performs highest (77) alongside Northern America and Europe (77), as seen in Table 1. However, according to the NCDs sub index score, sub-Saharan Africa performs best of any region in the world in NCD service coverage, which the report attributes largely to lower levels of tobacco use (as opposed to stronger health systems). The low scores for the other sub-indices—RMNCH, infectious diseases, and service capacity and access—suggest that weak service capacity and access is seriously undermining sub-Saharan Africa’s health systems and service coverage, compared to other regions.
Figure 2. UHC service coverage index by country, 2015, for monitoring SDG indicator 3.8.1
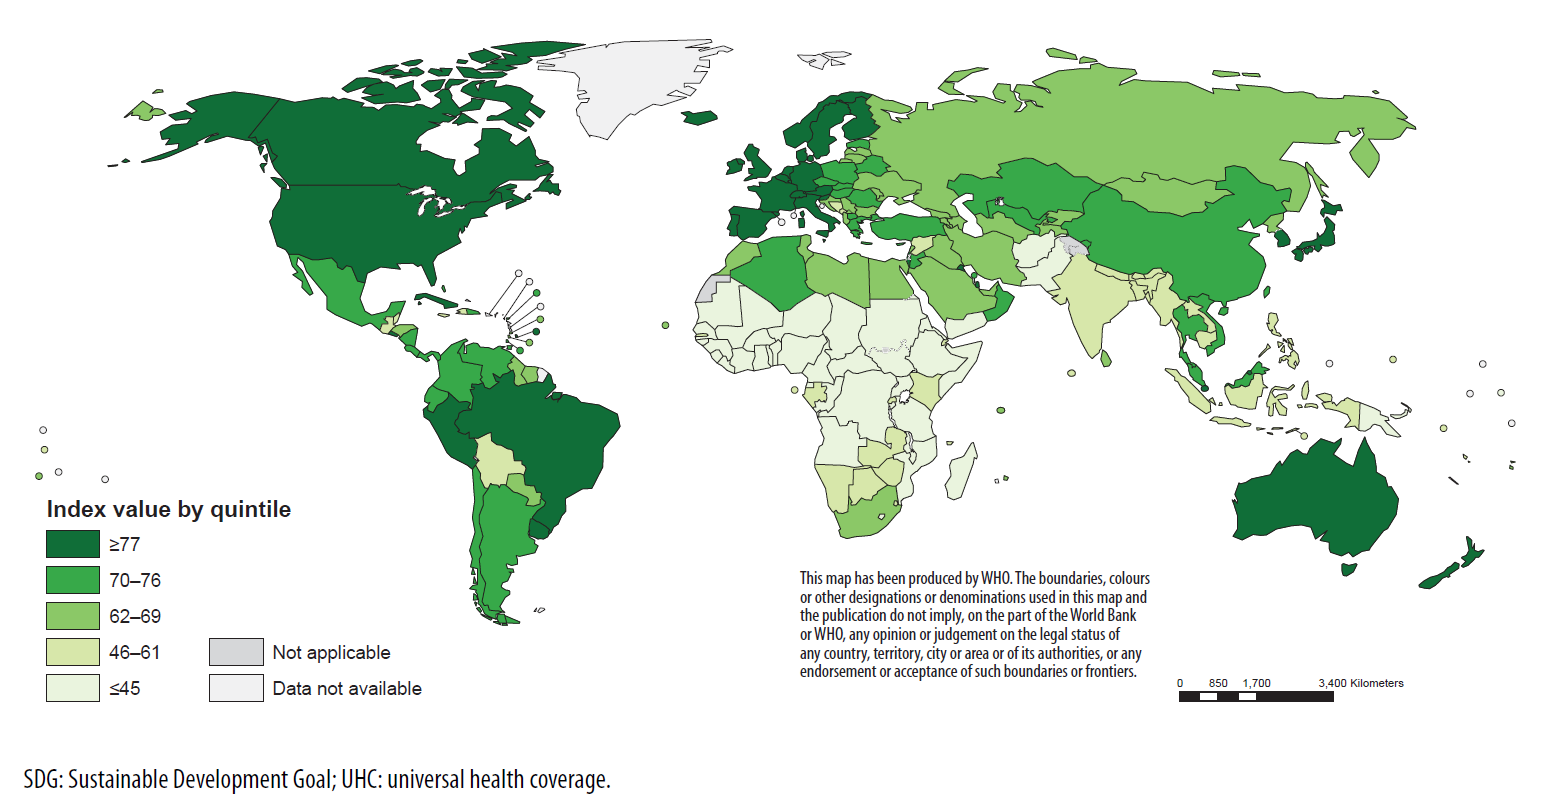
Table 1. Regional (population-weighted) means for the UHC service coverage index and its four component sub-indices
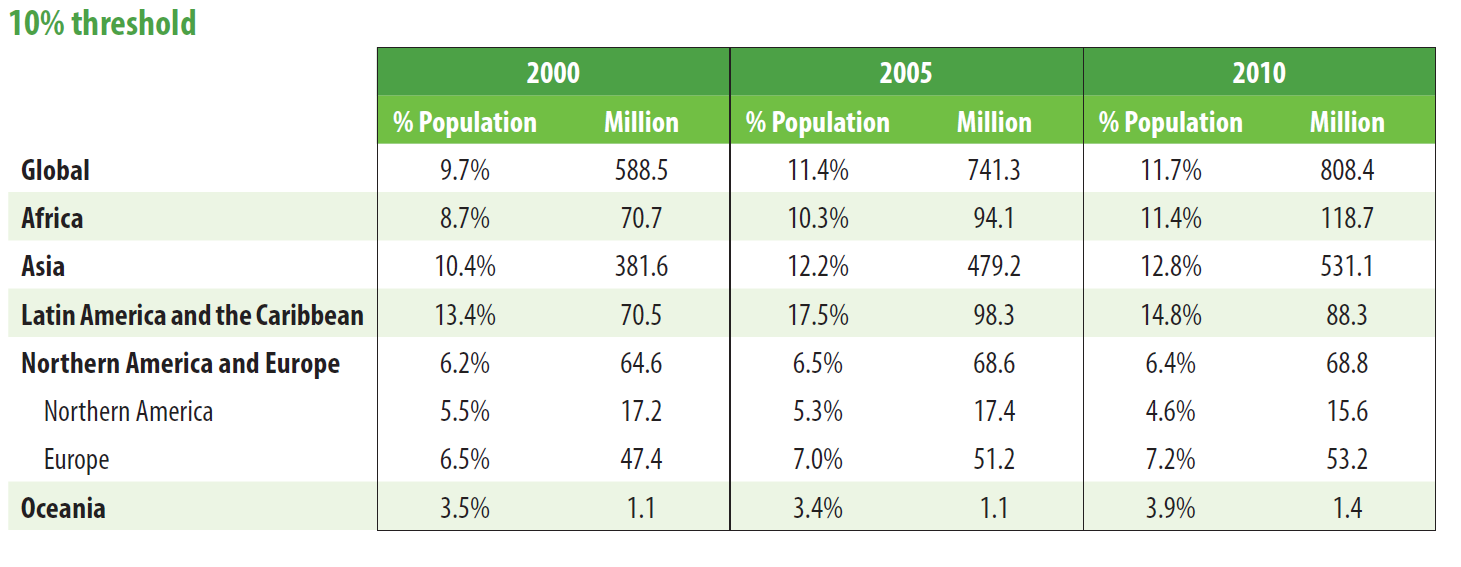
Meanwhile, in terms of financial protection, the report considers two main measures: catastrophic health spending and impoverishment due to health spending. The former is defined as the incidence of catastrophic out-of-pocket payments exceeding 10 percent of household total consumption or income, while the latter measures the incidence of impoverishment (at the $1.90-a-day poverty line, 2011 PPP) due to out-of-pocket health spending. In 2010, the regions with the highest incidence of catastrophic health spending were Latin America and the Caribbean (14.8 percent) and Asia (12.8 percent), closely followed by Africa (11.4 percent). Across all regions, the percentage and size of populations facing catastrophic payments have increased since 2000 (Table 2).
Table 2. Global and regional trends in catastrophic payments—SDG indicator 3.8.2
In terms of impoverishment due to health expenditures, 97 million people globally were impoverished (at the $1.90-a-day poverty line) due to out-of-pocket payments in 2010 (see Figure 3). Asia and Africa reported the highest rates of impoverishment due to health spending in the world, at 1.9 and 1.4 percent of their populations, respectively. These two regions accounted for 97 percent of the world’s population facing impoverishment due to out-of-pocket health payments. Still, the report notes a positive trend: Coverage of essential services has increased since 2000—particularly in terms of antiretroviral treatment for HIV (which rose from 2 percent coverage in 2000 to 53 percent in 2016) and use of insecticide-treated nets for malaria prevention (which rose from 1 percent coverage in 2000 to 54 percent in 2016).
Figure 3. Global and regional trends in impoverishment due to out-of-pocket health spending – 2011 PPP $1.90-a-day and 2011 PPP $3.10-a-day poverty lines
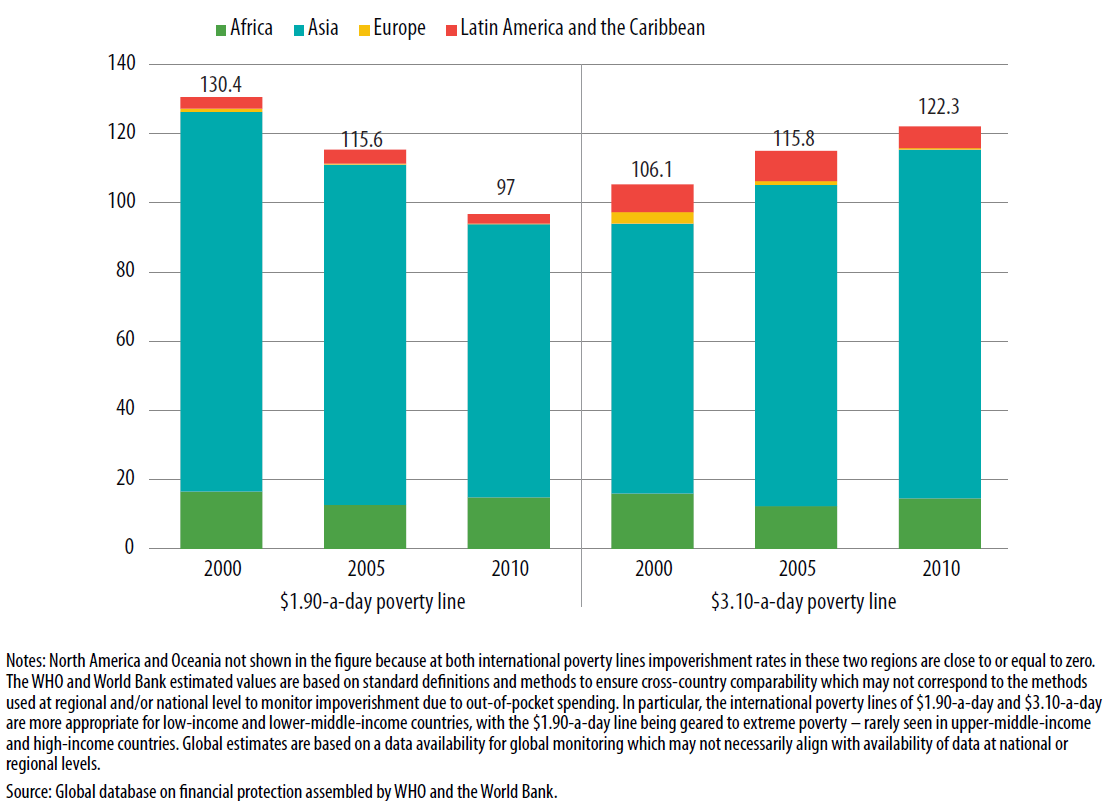
Furthermore, although catastrophic health spending has increased since 2000, impoverishment due to out of pocket health spending has been declining. The report argues that lower incidence of impoverishment due to spending on health could signify that people are receiving better protection from financial hardship. Alternatively, it could suggest that people are opting not to seek health care services because they are unaffordable. Finally, the report encourages countries to continue reporting their data and progress on indicators of both health care service coverage and financial protection as a part of their commitment to achieve universal health care coverage.
Related Content
Authors


Commentary
Figures of the week: Monitoring sub-Saharan Africa’s progress toward universal health care coverage
January 5, 2018