The Africa Growth Initiative Markets Monitor aims to provide up-to-date financial market and foreign exchange analysis for Africa watchers with a wide range of economic, business, and financial interests in the continent. Following the May 2016 update, the July 2016 update continues tracking the diverse performances of African financial and foreign exchange markets through June 30, 2016.
We offer our main findings below on the key recent events influencing the region’s economies, namely: the United Kingdom’s referendum results to leave the European Union (or “Brexit”) and spillover effects on African markets, the introduction of Nigeria’s new flexible exchange rate regime, and credit ratings reviews for South Africa and Mozambique.
Brexit’s immediate effects on African markets mainly hit South Africa and Kenya
As the results of the U.K.’s referendum on its EU membership were announced early on Friday, June 24, 2016, the “leave” outcome rattled global financial markets, and, in turn, sent ripples through African markets.
- Although equity markets fell on June 24, the declines were most pronounced in Kenya and South Africa, which lost about 4 percent in the week following the Brexit (see Figure 1). South Africa boasts liquid markets, which makes it susceptible to investors’ asset reallocation. In addition, since the EU remains one of South Africa’s top trading partners, and the U.K. is the fourth-biggest destination of South African exports, the effects of the Brexit on South Africa were greater than for other African countries less active in EU and U.K. trade.
- The benchmark MSCI Emerging Markets Index’s decline was more short-lived, decreasing by 3.5 percent in the day following the announcement, but returning to levels just 1.4 percent lower than those prior the announcement by the end of the week.
- The impact on bonds markets was muted (see Figure 2). African and global bond spreads increased by 27 basis points and 20 basis points, respectively, the day after the announcement, but fell closer to levels preceding the Brexit by the end of the week.
- The South African rand depreciated by 4.6 percent against the dollar immediately following the announcement. The Nigerian naira depreciated considerably against the dollar in the week following the results although the naira’s weakening can be attributed more directly to the country’s decision to introduce a flexible exchange rate regime on June 20 (discussed in the following section).
While the short-term effects of the Brexit were generally felt through capital and foreign exchange markets, in the long term the spillover channels which may be influenced by the Brexit include: lower growth in the EU and U.K. (suppressing demand for African goods and services) and potential reductions in tourism, remittances, trade, and aid. More information on how these channels are affected is needed to determine the economic impact of the U.K.’s departure from the EU. For more information on the potential effects of the Brexit on Africa, see the recent Africa in Focus blog by Mariama Sow and Amadou Sy: The Brexit: What implications for Africa?
Figure 1. Movements of select African equity indices and currencies following the Brexit announcement on June 24, 2016.
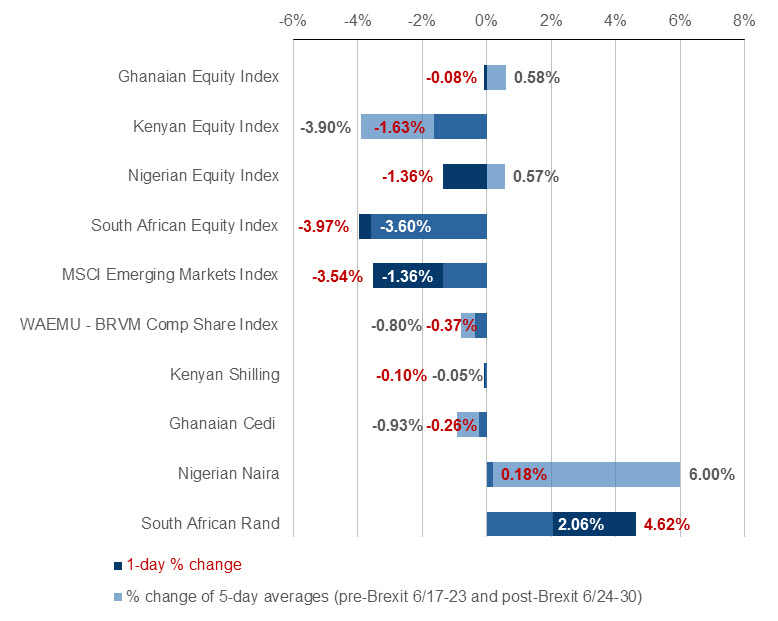
Source: Author’s calculations using Bloomberg Finance L.P. and J.P. Morgan Emerging Market Bond Index Global (EMBI Global).
Note: Equity indices are denoted in local currency terms, except for the MSCI Emerging Markets Index which is denoted in U.S. dollars. For currencies, positive changes indicate a weakening against the dollar.
Figure 2. EMBI Global spreads in basis points pre- and post-Brexit.
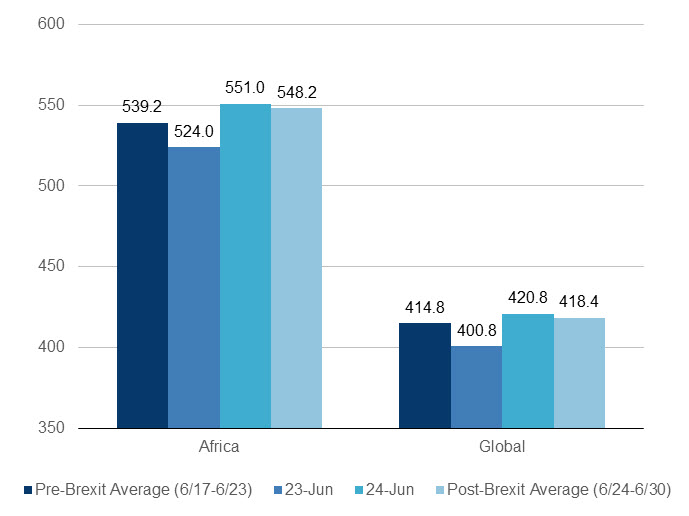
Source: Bloomberg Finance L.P., J.P. Morgan Emerging Market Bond Index Global (EMBI Global). Note: The EMBI Global includes only USD-denominated emerging markets sovereign bonds and uses a traditional, market capitalization-weighted method for country allocation. The Africa sovereign spread includes coverage of Angola, Côte d’Ivoire, Egypt, Gabon, Ghana, Kenya, Morocco, Mozambique, Namibia, Nigeria, Senegal, South Africa, and Zambia.
Nigeria’s stocks climb and spreads fall as it drops U.S. dollar peg
Monday, June 20, 2016 marked the first day of trading following Nigeria’s abandonment of its currency peg of 197-199 naira to the U.S. dollar and adoption of a flexible exchange rate regime. The naira declined by 42.0 percent against the dollar on that day alone to nearly half of its level in January 2015 (see Figure 12). Meanwhile, Figures 3 and 4 show that the Nigerian Stock Exchange All Share Index increased by 7.4 percent (in local currency terms), and bond spreads declined by 30.4 basis points compared to their average figures from the week preceding the devaluation. According to The Wall Street Journal, local investors have been purchasing shares in stocks due to concerns that inflation will diminish cash holdings. Bloomberg also reports that traders anticipate the naira may slide by another 10 percent before September 2016.
Figure 3. Nigerian Stock Exchange All Share Index prices before and after the introduction of the naira float on June 20, 2016.
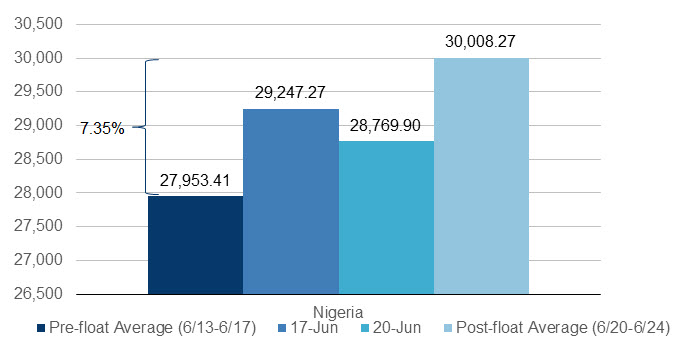
Source: Bloomberg Finance L.P.
Note: Prices given in local currency terms (naira).
Figure 4. Nigeria bond index spreads in basis points before and after the introduction of the naira float on June 20, 2016.

Source: Bloomberg Finance L.P., J.P. Morgan Emerging Market Bond Index Global (EMBI Global).
Commodity prices see slight gains
From its 12-year low in January 2016, the International Monetary Fund’s (IMF) all commodity price index continued to climb through June 2016, as seen in Figures 5 and 6. The fuel price index in particular has risen from 60.8 to 88.2 since January 2016 as production outages—notably in Canada and Nigeria—have diminished the excess of global supply, but still remains lower than its 2015 level (see Figures 5 and 6). Non-fuel prices are increasing as well; prices of agricultural goods are up generally due to weaker global supply while metals and industrial input prices grew due to mounting demand (particularly for iron ore and aluminum). Following the “Brexit” announcement on June 24, however, oil prices fell due to concerns that the U.K.’s exit from the EU would contract global growth and stymie demand for energy—although this is not reflected in the monthly figure. At the same time, safe-haven demand for precious metals such as gold and silver bolstered metals prices post-Brexit: Both gold and silver prices reached two-year highs following the outcome of the vote.
Figure 5. Commodity price indices (in January 2016 and June 2016).
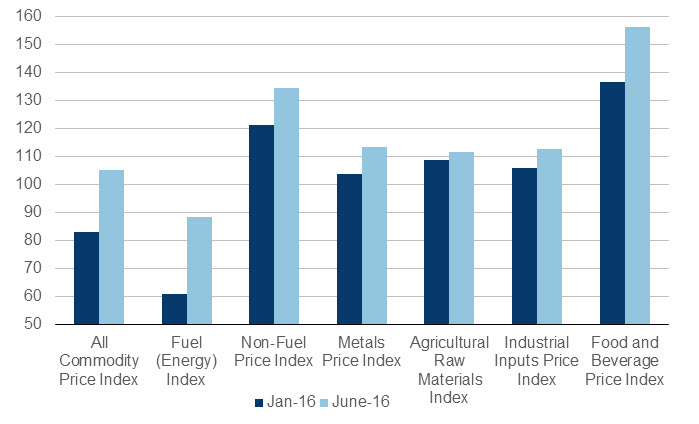
Source: IMF, Primary Commodity Price System.
Note: Index (2005 = 100).
Figure 6. Commodity price indices (January 2000 to June 2016).
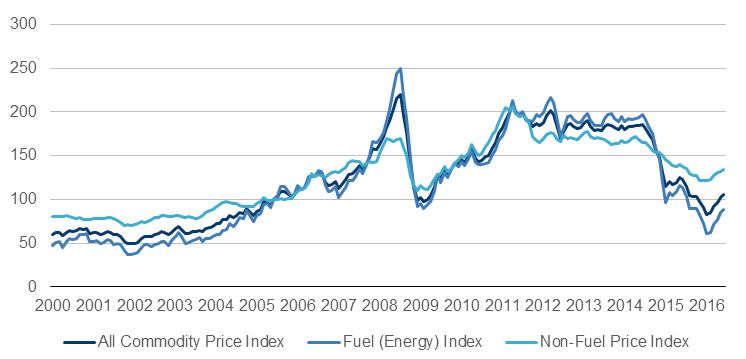
Source: IMF, Primary Commodity Price System.
Note: Index (2005 = 100).
Ghana’s stocks fall and Nigeria’s rise
From January 2016 through June 2016, Nigeria, South Africa, MSCI Emerging Markets, and the BRVM, saw slight growth in their equity indices, while Kenya’s equity index fell marginally and Ghana’s declined markedly—by 10.4 percent. Nigeria’s growth of 3.3 percent since January 2016 aligns generally with the MSCI Emerging Market Index increase of 5.0 percent and is thought to reflect investors’ anticipation of a new flexible exchange rate regime and subsequent currency devaluation that would boost share prices, despite the fact that a recession still threatens the economy. The slight uptick since January 2016 follows a long decrease in the Nigerian Stock Exchange All Share Index’s prices, from a high of 35,728 naira in April 2015 down 37.0 percent to a low of 22,456 in January 2016, from which it has been rebounding since then.
The benchmark Ghana Stock Exchange Composite Index is in a bear market, experiencing a long decline of 26.6 percent in its price from a peak of 2382.1 cedi in mid-June 2015 to a low of 1747.7 cedi on June 7, 2016. Slowing economic growth, plunging oil prices, currency volatility, and power shortages have all contributed to the decline. Kenya’s Nairobi Securities Exchange Ltd All Share Index’s relative decline in price—3.5 percent since January 2016—is in part owing to volatility surrounding the Brexit although the stock exchange index has been fluctuating throughout the year. According to Bloomberg, Kenyan companies are hoping to raise more capital via the stock market before the elections set for August take place and political risks rise, deterring investors.
Figure 7. Returns for select equity market indices (January 1, 2016 to June 30, 2016).
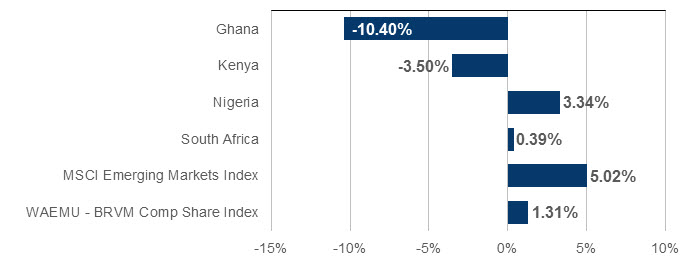
Source: Bloomberg Finance L.P.
Figure 8. Returns for select equity market indices (January 1, 2015 to June 30, 2016).
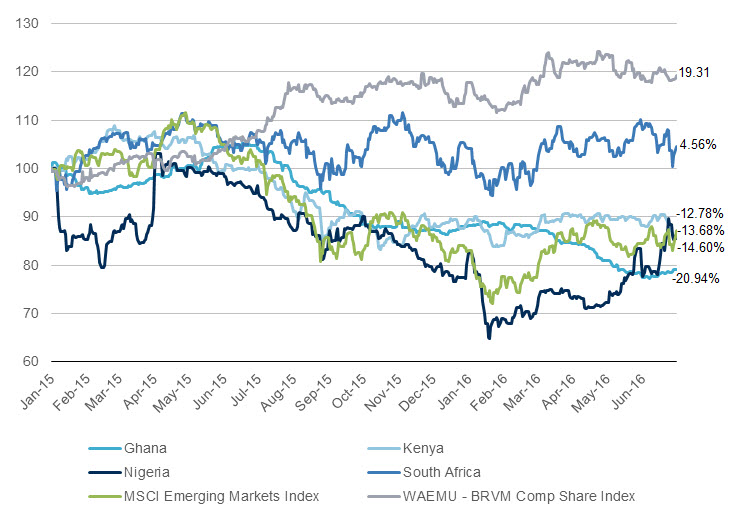
Source: Bloomberg Finance L.P.
Note: Index (January 1, 2015 = 100). Note: Index (January 1, 2015 = 100). All indicies are denoted in local currency terms, except for the MSCI Emerging Markets Index which is denoted in U.S. dollars.
Africa’s regional bond spread continues to rise
Since January 2016, African and global bond spreads have fallen by about 45 basis points (see Figure 10). However, most of this decline took place between January 2016 and mid-April 2016. Since then, spreads have leveled. African bonds now have on average yield spreads 5.32 percent above the U.S. 10-year Treasury bond rate, compared with the 4.07 percent for the global bond index.
Figure 9. Sovereign spreads v. credit rating scores.
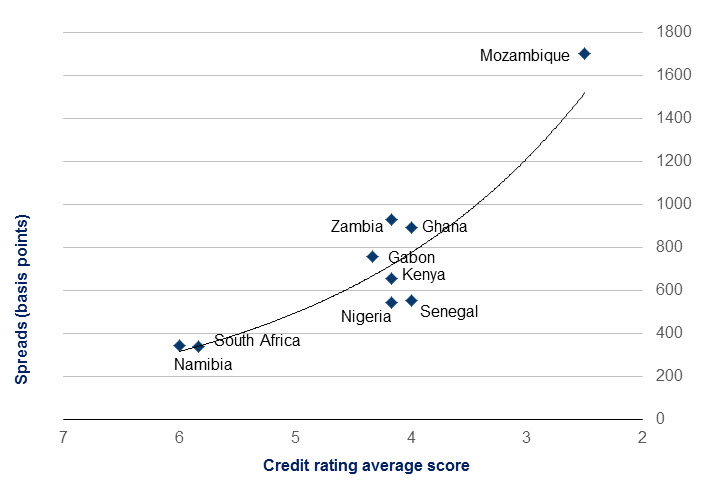
Source: Bloomberg Finance L.P., J.P. Morgan EMBI Global
Note: Spreads are as of June 30, 2016. Credit rating average scores refer to the average ratings of Fitch, Moody, and S&P ratings. Numerical values correspond to the following credit rating categories: 7 = A, 6 = BBB/Baa, 5 = BB/Ba, 4 = B, 3 = CCC/Caa, and 2 = CC/Ca.
Figure 10. EMBI Global spreads in basis points (January 2015 to June 2016).
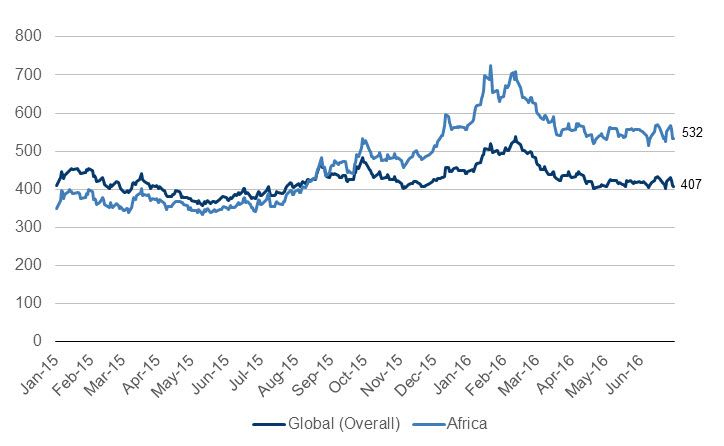
Source: Bloomberg Finance L.P., J.P. Morgan Emerging Market Bond Index Global (EMBI Global). Note: Series ends June 30, 2016. The EMBI Global includes only USD-denominated emerging markets sovereign bonds and uses a traditional, market capitalization weighted method for country allocation. The Africa sovereign spread includes coverage of Angola, Côte d’Ivoire, Egypt, Gabon, Ghana, Kenya, Morocco, Mozambique, Namibia, Nigeria, Senegal, South Africa, and Zambia.
Mozambique’s bond spread has continued to drive the increase in the Africa region’s bond index spread, as prospects for the repayment of the country’s nearly $1.4 billion in loans guaranteed to state-owned companies appears to be in jeopardy (see Figure 9). Fitch, Standard & Poor’s, and Moody’s have all downgraded Mozambique’s sovereign credit ratings since May 23, 2016, after the state-owned company Mozambique Asset Management (MAM) missed a May 23 deadline to repay $178 million in debt. Moody’s cited the “weak will of the government to honour its debt commitments, given the pressures it faces in terms of liquidity” as a key reason for its decision to lower the country’s credit assessment. Moody’s and S&P have both indicated their outlook for the country is “negative,” reflecting their estimations that Mozambique should be poised for future downgrades as well.
South Africa avoids junk status during credit review
South Africa has recently avoided a downgrade to junk status by credit ratings agencies Fitch, Moody’s, and S&P. On May 6, Moody’s affirmed that South Africa’s sovereign rating remains at Baa2 based on the country’s strong institutions and promising 2016/2017 budget, but assigned it a negative outlook due to the risks threatening to undermine the implementation of economic reforms. Then on June 3, S&P reviewed its BBB- rating—the lowest investment-grade rating—and maintained this rating, giving the country a negative outlook as well. Finally, Fitch reviewed South Africa’s credit on June 8, similarly keeping the country’s rating at BBB-, however, it assessed the country’s outlook as stable. Avoiding downgrades during this most recent round of reviews gives South Africa much needed breathing space to enact policy reforms to boost the economy—especially in time for local elections in August—and stave off future downgrades during the next round of reviews in December.
Table 1. Sovereign credit ratings and outlooks for select African economies (Updated: July 8, 2016).
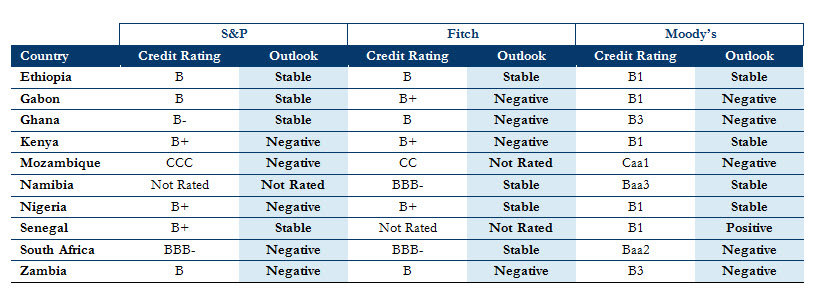
Source: Bloomberg Finance L.P., Standard & Poor’s, Fitch, and Moody’s.
South African rand declines precipitously against the dollar and Nigeria implements flexible exchange rate regime
Ghana’s and Kenya’s currencies have remained relatively stable against the dollar since January 2016, while South Africa’s rand has been more volatile, and Nigeria’s naira has depreciated significantly, as seen in Figure 12. The rand’s steep change is owed mostly to investor concerns surrounding the country’s sovereign credit ratings reviews, political tensions over the stated arrest of Finance Minister Pravin Gordhan (which did not, in fact, occur), and the short-term effects of the Brexit. The Nigerian naira’s stability through June 17 on the other hand, remained entirely due to exchange controls imposed by the government, although Central Bank Governor Godwin Emefiele announced in late May that Nigeria would switch to a more flexible dual exchange rate regime and did so on June 20, causing the currency to depreciate by 42 percent against the dollar in one day. As of June 30, the naira had the lowest spot returns of any African currency in 2016, while the Zambian kwacha has performed the best, with the highest spot returns (see Figure 11).
For more analysis on the implications of the floating naira, see Amadou Sy’s Africa in Focus blog: Moving the naira to a flexible exchange rate must be accompanied by strong policies.
Figure 11. Spot returns of select African currencies (%, January 1, 2016 to June 30, 2016).
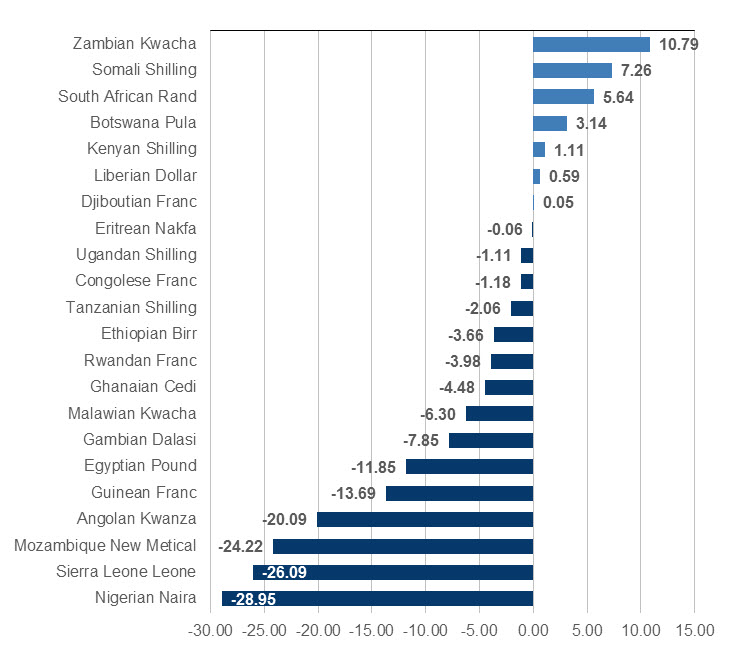
Source: Bloomberg Finance L.P.
Figure 12. Movements of select African currencies against the U.S. dollar (January 2015 to June 2016).
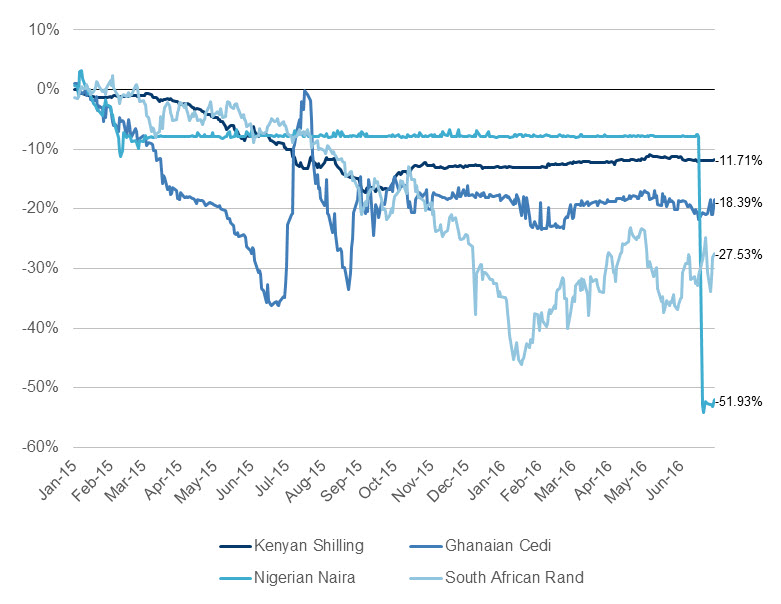
Source: Bloomberg Finance L.P. Note: A positive move indicates currency strengthening against the dollar, while a negative move indicates currency weakening against the dollar. Index (January 1, 2015 = 0).
Related Content

Related Books


Commentary
AGI Markets Monitor: Brexit’s impact on Africa, Nigeria’s new exchange rate regime, and South Africa’s credit reviews
July 21, 2016