While the South African labor market faces many large challenges, some more subtle trends might also be developing that undermine the country’s growth. Yes, the current level of unemployment stands at 24 percent. True, school dropout rates remain high: Only 50 percent of students will make it to the last year of high school, which means that the number of skilled workers in the country remains low. In addition, income inequality in South Africa is an overwhelming obstacle—with the country having one of the highest Gini coefficients (a statistical tool commonly used to measure inequality) in the world—and has been slowing its fight against poverty.
In their recent paper, Demographic, employment, and wage trends in South Africa, Haroon Bhorat, Karmen Naidoo, Morné Oosthuizen, and Kavisha Pillay examine important, perhaps precarious, trends in South African employment, such as the combination of South Africa’s weak educational system and labor demand biased toward skilled workers and the significant rise in temporary employment over full-time positions. However, the authors argue that perhaps the most interesting is the spike in public sector employment and the subsequent development of a new segment of the labor market, what they call a “new elite”: the unionized public sector employee.
The shift to services and the public sector
Like so many of sub-Saharan African countries, South Africa’s labor makeup (as well as contributions to GDP) has swiftly been shifting towards the services sector, especially since 2001. Table 1 clearly shows the dramatic shift in labor towards community, social, and personal (CSP) services and financial services: These two areas accounted for 73 percent of the shift in employment between 2001 and 2012 (Column 3).
| Employment Shares Share of Change (ΔEi/ΔE) (a) |
|||
| 2001 | 2012 | (2001-2012) | |
| Primary | 0.15 | 0.07 | -0.28 |
| Agriculture | 0.1 | 0.04 | -0.2 |
| Mining | 0.05 | 0.02 |
-0.08 |
| Secondary | 0.2 | 0.21 |
0.21 |
| Manufacturing | 0.14 | 0.12 |
0.04 |
| Utilities | 0.008 | 0.008 |
0.004 |
| Construction | 0.05 | 0.07 |
0.16 |
| Tertiary | 0.63 | 0.71 |
1.08 |
| Trade | 0.21 | 0.21 |
0.2 |
| Transport | 0.04 | 0.6 | 0.11 |
| Financial | 0.09 | 0.13 | 0.31 |
| CSPS | 0.17 | 0.22 | 0.42 |
| Private households | 0.09 | 0.08 | 0.04 |
| Total | 1 | 1 | 1 |
Note: 1. CSPS stands for community, social, and personal services, which is predominantly made up of public sector employment.)
2.(a) The ratio of the percentage change in the share of employment to the overall change in employment over the period (share of change in employment). This measure shows, within each broad sector, where the sources of employment growth are. For example, employment in the tertiary sector is 1.08 times (or 108 percent of) the level of employment in 2001, which is the sum of the changes for all the industries within this sub-sector. CSPS then is the greatest contributor to employment growth in the tertiary sector.
Source: Bhorat et al. (2014) using PALMS dataset (2012).
Importantly, the authors emphasize, the CSP sector, which accounted for 42 percent of this shift, is mostly made up of public sector jobs—hinting that expansion of the public sector has contributed to this trend. The share of public sector employment rose to 17.5 percent by the end of 2014 from 14.2 percent in 2004. In addition, they note that the largest expansion of the public sector came in 2009, just after the global financial crisis, showing that the public sector was more capable of absorbing” excess unskilled and medium-skilled labor at times of economic and labor market distress.”
Another important trend the authors point to within the shift to the public sector between 2008 and 2014 is that a great number of jobs in which employment grew quickly involve unskilled workers (such as sweepers, farmhands and laborers, helpers and cleaners, construction and maintenance laborers, and garbage collectors) and medium-skilled workers (such as police and traffic officers, institution and home-based care workers, prison guards, cooks, and childcare workers) (Figure 1). For a deeper analysis of South African labor market’s skill needs, see the full paper.
Figure 1: Share of change in public sector jobs by detailed occupation (2008 Q1-2014 Q4)
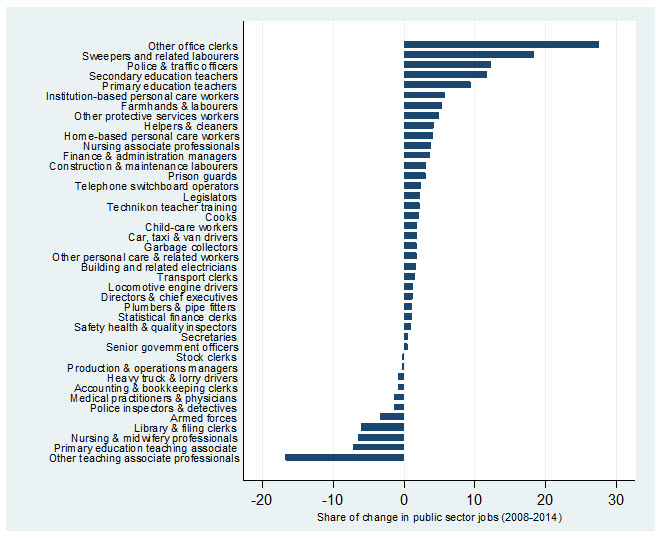
Notes: These occupations are the largest 42 public sector occupations, making up 80 percent of total employment in the public sector in 2014, and 97 percent of the change in the number of public sector jobs over the 2008-14 period.
Source: StatsSA QLFS 2008Q1; StatsSA QLFS 2014Q4; own calculations.
From these trends, the authors infer that the South African government’s Expanded Public Works Program (EPWP)—which “creates jobs through government-funded infrastructure projects, through its non-profit organization and community work program, as well as through its public environment and culture programs”—has played a major part in the expansion of the public sector.
Interestingly, though, the authors also find that overall the public sector has a bigger proportion of high-skilled employees than the private sector), though, between 2008 and 2013 the public sector barely saw a change in its proportion of high-skilled workers. Rather, it experienced its largest growth in the medium- and low-skilled jobs, as noted in Figure 1. They note that this phenomenon suggests that “the state [is] able to absorb excess unskilled and medium-skilled labor at times of economic and labor market distress.” The private sector’s proportion of high-skilled workers, on the other hand, grew by 25 percent. There is then, they say, a “mismatch” between the supply and demand of South Africa’s labor market when it comes to high-skilled workers.
After exploring this trend, the authors also delve into the demographic differences between public and private sector workers. For example, they find that the average public sector worker is older (41 versus 38) and likely to have a higher educational level on average. There are more women in the public sector—52 percent compared to 44 percent. There are also more Africans—77 percent in the public sector (up from 72 percent in 2008) and 66 percent in the private sector (unchanged). The authors argue that these two statistics demonstrate that public sector has “transformed” its labor force at a faster pace since both are groups that historically have been marginalized in the South African labor market.
The impact of unions in the South African labor market
The public sector in South Africa also has a higher unionization rate: 69.2 percent compared to the private sector’s 24.4 percent rate in 2013). As public sector employment has grown, the authors say, so has its proportion of workers in unions. Unions in South Africa are influential, as the authors note, “Powerful labor unions are often associated with creating a wage premium for their members, given their ability to mobilize industrial action and negotiate in favor of their members during times of wage negotiations.”
Indeed, this seems to be the case. Past studies have found that bargaining power—as part of a bargaining council or a union—presents a wage premium. The authors have similar results: The average public sector worker makes 11,668 rand ($1,209) per month compared to an average private sector employee (7,822 rand per month). Most importantly, though, when the authors disaggregate based on participation in a union, they actually find that, among non-unionized workers, the private sector employee actually receives a higher wage than the public sector worker, by about 952 rand per month. This finding, they say, suggests that the public sector premium might be tied to public sector union membership.
The authors admit a caveat: Public sector union workers tend to be white, older, and better educated than their non-unionized public sector counterparts. In fact, non-union public sector workers are 80 percent African and 10 percent colored[1] (two groups more likely to be under the EPWP). In addition, non-union occupations are usually less skilled (elementary occupations, service and sales occupations, and technical and associate professional occupations). However, they emphasize, “Ultimately though, the wage distributions above suggest that, at least in terms of earnings, a dual labor market may indeed be prevalent in the South African labor market.” (For the authors’ full quantitative analysis, including an examination of how this trend interacts with state-owned enterprises and temporary workers, see the full paper.)
Thus, they argue, a “new labor elite” is forming.
Note: The African Lions project is a collaboration among United Nations University-World Institute for Development Economics Research (UNU-WIDER), the University of Cape Town’s Development Policy Research Unit (DPRU), and the Brookings Africa Growth Initiative, that provides an analytical basis for policy recommendations and value-added guidance to domestic policymakers in the fast-growing economies of Africa, as well as for the broader global community interested in the development of the region. The six papers, covering covering Mozambique, Kenya, Ghana , South Africa, Ethiopia, and Nigeria, explore the key constraints facing African economies as they attempt to maintain a long-run economic growth and development trajectory.
[1] In this paper, “African” is used to refer to people classified by the apartheid state as “native,” “Bantu,” or “black.” “Colored” refers mainly to people in the Western Cape province, and is an ethnic label for people of mixed ethnic origin who possess ancestry from Europe, Asia, and various Khoisan and Bantu tribes of Southern Africa.
Authors


Commentary
African Lions: A ‘new elite’ in the South African labor market?
June 29, 2016