It is estimated that there are 95 mobile phone subscriptions per 100 inhabitants worldwide, and this boom has not been lost on the developing world, where the number of mobile users has also grown at rocket speed. In fact, in recent years the information communication technology (ICT) revolution has provided opportunities leading to “death of distance,” allowing many obstacles to better livelihoods, especially for those in remote regions, to disappear. Remarkably, though, the huge proportion of poverty-stricken populations in so many of those same regions persists.
How might, then, we think differently on the relationship between these two ideas? Can and how might ICTs act as an engine for eradicating poverty and improving the quality of life in terms of better livelihoods, strong education outcomes, and quality health? Do today’s communication technologies hold such potential?
In particular, the mobile phone’s accessibility and use creates and provides us with an unprecedented volume of data on social interactions, mobility, and more. So, we ask: Can this data help us better understand, characterize, and alleviate poverty?
Mapping call data records, mobility, and economic activity
The first step towards alleviating poverty is to generate poverty maps. Currently, poverty maps are created using nationally representative household surveys, which require manpower and time. Such maps are generated at a coarse regional resolution and continue to lag for countries in sub-Saharan Africa compared to the rest of the world.
As call data records (CDRs) allow a view of the communication and mobility patterns of people at an unprecedented scale, we show how this data can be used to create much more detailed poverty maps efficiently and at a finer spatial resolution. Such maps will facilitate improved diagnosis of poverty and will assist public policy planners in initiating appropriate interventions, specifically at the decentralized level, to eradicate human poverty and ensure a higher quality of life.
How can we get such high resolution poverty maps from CDR data?
In order to create these detailed poverty maps, we first define the virtual network of a country as a “who-calls-whom” network. This signifies the macro-level view of connections or social ties between people, dissemination of information or knowledge, or dispersal of services. As calls are placed for a variety of reasons, including request for resources, information dissemination, personal etc., CDRs provide an interesting way to construct a virtual network for Senegal.
We start by quantifying the accessibility of mobile connectivity in Senegal, both spatially and across the population, using the CDR data. This quantification measures the amount of communication across various regions in Senegal. The result is a virtual network for Senegal, which is depicted in Figure 1. The circles in the map correspond to regional capitals, and the edges correspond to volume of mobile communication between them. Thicker edges mean higher volume of communication. Bigger circles mean heavier incoming and outgoing communication for that region.
Figure 1: Virtual network for Senegal with MPI as an overlay
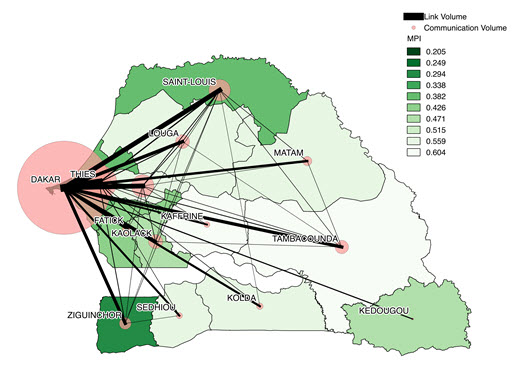
Source: Author’s rendering of the virtual network of Senegal based on the dataset of CDRs provided as a part of D4D Senegal Challenge 2015
Figure 1 also shows the regional poverty index[1] as an overlay. A high poverty index corresponds to very poor regions, which are shown lighter green on the map. It is evident that regions with plenty of strong edges have lower poverty, while most poor regions appear isolated.
Now, how can we give a more detailed look at the distribution of poverty? Using the virtual network, we extract quantitative metrics indicating the centrality of each region in Senegal. We then calculate centrality measures of all the arrondissements[2] within a region. We then correlate these regional centrality measures with the poverty index to build a regression model. Using the regression model, we predict the poverty index for each arrondissement.
Figure 2 shows the poverty map generated by our model for Senegal at an arrondissement level. It is interesting to see finer disaggregation of poverty to identify pockets of arrondissement, which are most in need of sustained growth. The poorer arrondissements are shown lighter green in color with high values for the poverty index.
Figure 2: Predicted poverty map at the arrondissement level for Senegal with MPI as an overlay
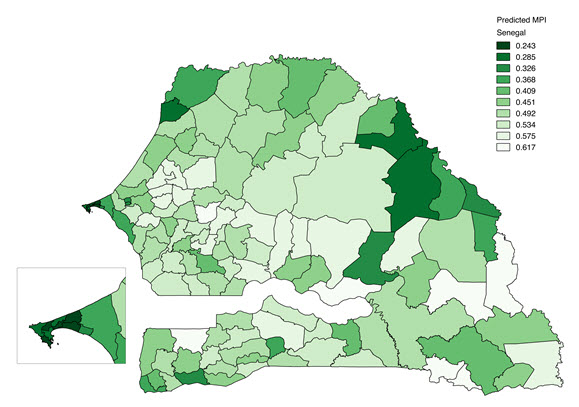
Source: Author’s rendering of the virtual network of Senegal based on the dataset of CDRs provided as a part of D4D Senegal Challenge 2015.
What is next for call data records and other Big Data in relation to eradicating poverty and improving the human development?
This investigation is only the beginning. Since poverty is a complex phenomenon, poverty maps showcasing multiple perspectives, such as ours, provide policymakers with better insights for effective responses for poverty eradication. As noted above, these maps can be used for decomposing information on deprivation of health, education, and living standards—the main indicators of human development index.
Even more particularly, we believe that this Big Data and our models can generate disaggregated poverty maps for Senegal based on gender, the urban/rural gap, or ethnic/social divisions. Such poverty maps will assist in policy planning for inclusive and sustained growth of all sections of society. Our methodology is generic and can be used to study other socio-economic indicators of the society.
Like many uses of Big Data, our model is in its nascent stages. Currently, we are working towards testing our methodology at the ground level in Senegal, so that it can be further updated based on the needs of the people and developmental interventions can be planned. The pilot project will help to “replicate” our methodology in other underdeveloped countries.
In the forthcoming post-2015 development agenda intergovernmental negotiations, the United Nations would like to ensure the “measurability, achievability of the targets” along with identification of ‘technically rigorous indicators’ for development. It is in this context that Big Data can be extremely helpful in tackling extreme poverty.
Note: This examination was part of the “Data for Development Senegal” Challenge, which focused on how to use Big Data for grass-root development. We took part in the Data Challenge, which was held in conjunction with NetMob 2015 at MIT from April 7-10, 2015. Our team received the National Statistics prize for our project titled, “Virtual Network and Poverty Analysis in Senegal.” This blog reflects the views of the authors only and does not reflect the views of the Africa Growth Initiative.
[1] As a measure of poverty, we have used the Multidimensional Poverty Index (MPI), which is a composite of 10 indicators across the three areas: education (years of schooling, school enrollment), health (malnutrition, child mortality), and living conditions.
[2] Senegal is divided into 14 administrative regions, which are further divided into 123 arrondissements.
Commentary
Big Data for improved diagnosis of poverty: A case study of Senegal
June 2, 2015