DIGITAL TOOLS FOR REAL-TIME DATA COLLECTION IN EDUCATION
Real-time performance data in education enable critically needed tracking of program activities and instructors’ and learners’ progress to better inform adaptations along the way. In this report, we provide an overview of some of the key considerations related to real-time data collection in education, with a particular focus on the digital tools that enable their collection. Importantly, we have developed a typology of tools and selection criteria to support policymakers, practitioners, and researchers around the globe in either developing new tools or selecting from the landscape of existing ones. Our aim is to help initiate dialogue around the use of real-time data for adaptive management in education and contribute to data-informed decisions toward ensuring that all children have access to quality teaching and learning experiences.
Introduction
The availability of—and access to—real-time performance data from classrooms and other learning spaces will be critical in addressing the increasingly dire learning crisis facing today’s children and youth. Real-time performance data focus on the ongoing tracking of program activities and progress of instructors and learners in order to better inform adaptations to program inputs, activities, and outputs along the way. Administrators (such as school or government leaders or program facilitators) can use information on performance to adaptively manage resources and tailor programs according to the needs of students and instructors. Similarly, instructors can use student data to ensure that they are teaching at the right level and customize their instruction based on individual learning patterns and needs. Students and families can use real-time data to track progress and use this information to advocate for their needs.
Collecting data in real time is inherently challenging. Paper-based systems of data collection can be slow, administratively burdensome, and prone to human error. Digital technologies potentially offer more efficient collection and analysis of real-time data, allow for more flexibility and customizability, and can provide functionalities such as automatically generated visualizations and ongoing recommendations.
In this report, we provide an overview of the critical factors related to real-time data collection in education to support policymakers, practitioners, and researchers across the globe in either developing new tools or selecting from the landscape of existing ones. After providing brief background on the state of data and measurement in the global education sector, we explore the who, why, and for whom of real-time data collection and use in education systems. Next, we focus our attention on one part of the puzzle—digital tools for data collection. Informed by survey responses from the developers of over 20 such tools, we classify tools based on a typology of their purpose. We elaborate on important factors such as tool usability, functions, and context, which can help decisionmakers select the most appropriate tool for their setting (potentially reducing the need to develop new ones where they already exist), or inform the design of a new tool. These sections are accompanied by an interactive database of digital tools for real-time education data. We conclude with key findings and policy recommendations.
Tackling the learning crisis is made more difficult due to the global data gap on learning outcomes.
The purpose of this report is not to assess the impact that a particular tool or type of tool may have on learning outcomes. Rather, the value-add of the report and the framework presented within—as the first of their kind—is to help initiate dialogue around the use of real-time data for adaptive management in education and to scope the wide array of digital tools for real-time data collection currently available in the education sector. This will help address the complex challenges faced in the education ecosystem and is just the beginning of an iterative process of action-oriented research. As such, new criteria and dimensions will likely be added as this work evolves—along with additional tools—with the help of crowdsourcing from the education community.
Tracking learning progress
Over the past decade, there has been a shift in the discourse within the global education sector from one of access to one of access plus learning. The “Global Compact on Learning” report (Perlman Robinson, 2011) called for, among other things, an emphasis on measurement as one of the six core principles to achieve learning for all. This jumpstarted a discussion that led to the establishment of the Learning Metrics Taskforce that was instrumental in catalyzing a shift in the global education conversation and building consensus on global learning indicators and actions to improve the measurement of learning in all countries (UNESCO & Center for Universal Education, 2013). The taskforce identified and recommended a set of key skills and competencies that all children should learn globally and developed a framework of indicators to track this learning at the global level. Finally, with the codification of child learning outcomes in Sustainable Development Goal (SDG) 4, quality of schooling and learning became the central focus of all global education targets, representing a significant advancement from the Millennium Development Goals’ focus on access to education. Furthermore, SDG 4 expands the scope of what is considered a “learning outcome” to include not only literacy and numeracy but also socio-emotional “skills needed to promote global citizenship and sustainable development” (Target 4.7).
Recent advancements in measuring learning and establishing comparability have been instrumental in the development of global indicators that may be used to evaluate learning systems and students’ learning levels across countries. When the World Bank and UNESCO introduced the Learning Poverty indicator in October 2019, it became even more evident that the world was in the throes of a global learning crisis. The metrics indicated that 53 percent of all children in low- and middle-income countries were not attaining the minimum reading proficiency by the age of 10 or by the end of primary school—and given the slow pace of progress—it would be impossible to reduce learning poverty rates to zero by 2030 (World Bank, 2021; Azevedo, 2020).
The COVID-19 pandemic’s unparalleled effect on global education—and its impact on learning has been particularly severe among marginalized populations—has only deepened the global learning crisis. In terms of learning poverty levels, low- and middle-income countries may potentially see a sharp increase of up to 70 percent. While the costs and magnitude of the crisis are yet to be fully realized, it is estimated that this current generation of students could lose up to $21 trillion in lifetime earnings (in present value) due to the learning loss—a significant increase from the projected $10 trillion loss pre-COVID (World Bank, UNICEF, & UNESCO, 2022).
Tackling the learning crisis is made more difficult due to the global data gap on learning outcomes. Many countries lack sufficient data and/or the capacity to measure and monitor learning outcomes, which is impeding the advancement of evidence-based policies (UNESCO & CUE, 2013). While substantial losses in both reading and math skills have been documented across countries to varying extents, data on learning loss—not to mention data on socio-emotional well-being—remain scarce (World Bank, UNICEF & UNESCO, 2021). This makes it more difficult to estimate the full scale of the crisis and to provide a precise estimate of students’ learning levels and well-being. Robust data to inform policymaking, track progress, and hold policymakers, practitioners, and funders accountable are crucial. A report from the Center for Global Development posits that institutionalized evaluation of interventions can act as an “economic safeguard” that can ensure that only effective interventions are scaled (Kaufman et al., 2022).
While it is true that measurement of outcomes is essential to improving learning, measurement should also be in a form that makes it actionable, at the right frequency, and accessible. Data must be usable through a range of tools serving different purposes and by various stakeholders—for example, ranging from formative classroom assessments to inform teacher instruction, to national and international levels of assessment for policy prioritization and standards benchmarking. Lack of systematic measurement and data collection not only makes it difficult to assess current learning levels, but also makes it hard to know which actions are making a difference, and where and how to promote action.
Real-time data
Real-time data for development
With the growing emphasis on measurement in education systems, the education and international development communities in recent years have placed greater emphasis on continual data collection that can support data-driven adaptive management of programs. In contrast to final program or intervention evaluation data (which saw a boom in the early 2000s with the randomized controlled trial movement), real-time data are gathered along the way and analyzed quickly, which enable timely decisions and adaptation. In multiyear social programs or policy efforts, meaningful results for program participants hinge on understanding what is and is not working—and for whom—during the cycle of implementation. This allows improvements to be made, as opposed to after the program or policy cycle has ended, when it is too late to make changes.
Real-time data are gathered along the way and analyzed quickly, which enable timely decisions and adaptation.
A range of efforts are underway to raise the profile and rigor of real-time data collection and use across the field of international education and development more broadly. For example, a consortium led by Results for Development is building evidence on adaptive program implementation through the rapid feedback monitoring, evaluation, research, and learning as part of a collaboration with USAID (Benson et al., 2019). Also at USAID, “adaptive management” is one of the core principles of the program cycle and is understood as “an intentional approach to making decisions and adjustments in response to new information and changes in context.” Notably, adaptive management practices are much more likely to thrive with the right enabling conditions: culture, processes, and resources. As a result, considering the context’s enabling conditions and working to address the “disabling” elements is critical for adaptive management adoption (USAID, 2018).
Outcomes-based financing, real-time data, and adaptive management
A rise in interest in outcomes- and results-based financing (including social and development impact bonds and outcomes funds) among policymakers, funders, and practitioners has drawn further attention to real-time data and adaptive management. The focus on results within this form of innovative finance necessitates the collection of data in real-time to inform feedback loops for better service delivery to achieve the outcomes on which the contracts are based (Tomkinson, 2015). Establishing and refining systems of adaptive management has thus become a core task for service providers engaging in outcomes-based contracting, including improving data management capacity and employing technological solutions to enable efficient data use (World Bank, 2014).
This adaptive management approach prioritizes “learning by doing” (Ramalingam et al, 2017), but by firmly relying on systematically collected data. Such adjustments can be either tactical—that is, targeting immediate operational processes—or strategic—addressing systemic shortcomings in the mechanics of the program itself. One well-cited example of this is the Educate Girls Development Impact Bond (Gustafsson-Wright, Osborne, & Massey, 2020), where a strong system of adaptive management was developed within the project, allowing for timely course correction and ultimately a positive impact on student outcomes.
Real-time data for education
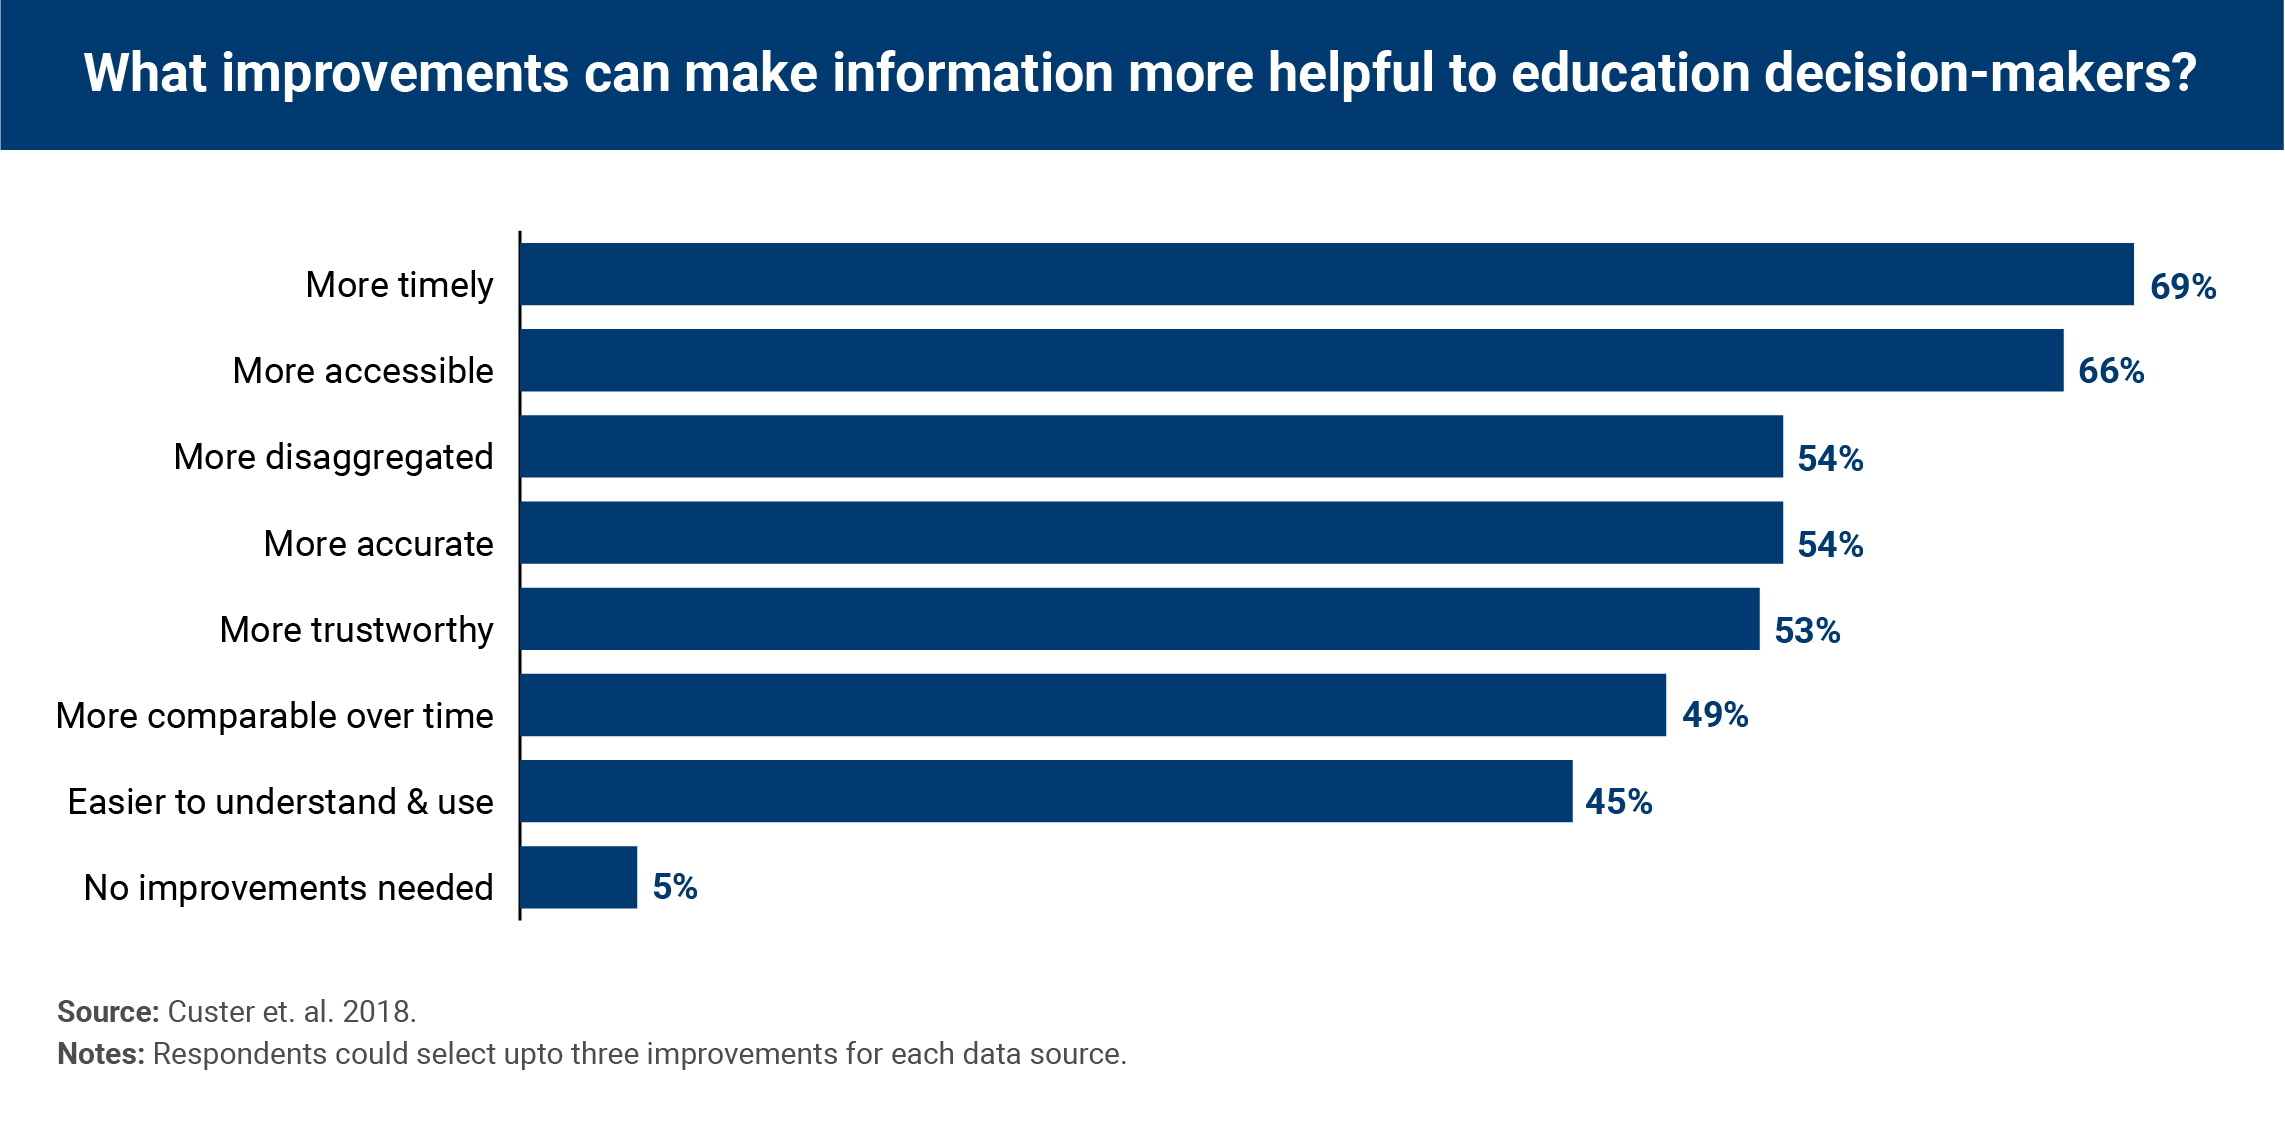
Within the education sector, the conversations about timely data provision are centered around the focus on equitable learning outcomes and as part of a broader movement toward data-driven decisionmaking at all levels of the education system. In fact, many education decisionmakers have highlighted the need for more timely and accessible data. For example, in a 2017 survey of education leaders from around the world, timeliness and accessibility were ranked as the top two areas in need of improvements to make data in the education sector more helpful (Custer et al., 2018).
FIGURE 1
We have seen a response to this need at the global policy level. As a follow-up to the 2018 World Development Report (World Bank, 2018) recommendations, for example, the World Bank—supported by the Bill and Melinda Gates Foundation and the U.K. Department for International Development—announced the establishment of the Global Education Policy Dashboard, which aims to provide policymakers with actionable data on indicators associated with learning outcomes (inputs and infrastructure, teaching, learners, school management, and learning poverty) in basic education (World Bank, 2019).
This and similar types of policy responses are critical because real-time data have the potential to achieve equitable positive learning outcomes by facilitating timely decisionmaking and course corrections and represent an important shift from program monitoring data, which primarily track how much an education program’s activities and outputs align with intended milestones, as well as possible unintended consequences. While program monitoring data are important, they rely on critical assumptions about the links among activities, outputs, and the proposed final outcomes, which may or may not occur. Real-time performance data, on the other hand, track ongoing program activities and instructors’ and learners’ progress to better inform data-driven adaptations to program inputs, activities, and outputs along the way (Black & Wiliam, 2008). In this way, real-time data can inform the design and management of a variety of education programs and initiatives (GIZ, 2017).
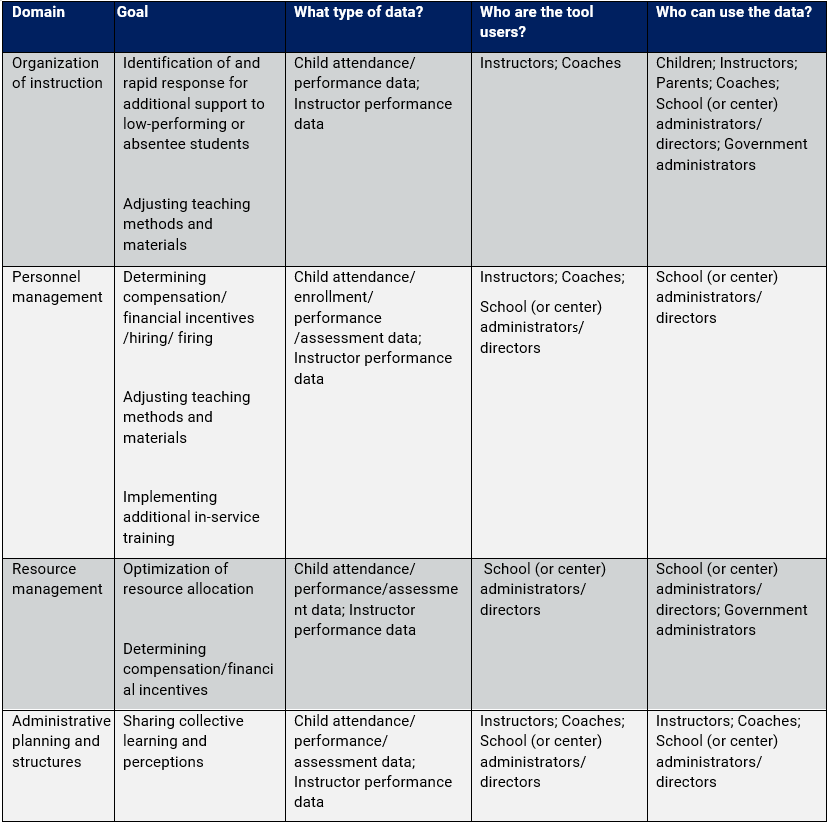
As shown in Table 1, there are a variety of reasons to collect real-time data in education, which correlate with the types of data collected and the users of the data and tools. The collection of these data can encompass a variety of domains, including organization of instruction, personnel management, resource management, and administrative planning. Across these domains, data are primarily used for tracking and responding to student and instructor behavior and performance with the goal of ensuring student learning. Broadly speaking, the types of real-time data needed to achieve these goals can include: child (or student) attendance and enrollment, child (or student) performance data (or assessment), instructor (or other service provider) attendance, and instructor (or other service provider) performance, which can be self- or objective assessment. These data can be collected and used by many actors in the education system, ranging from children and their parents, to instructors, coaches, and school administrators, to high-level government administrators.
TABLE 1. A taxonomy of real-time education data
Assessing student performance can take multiple forms—for example, conducting examinations to track individual student progress and inform learning strategies. Formative classroom assessments (for example periodic quizzes, assignments, or learning checks) are one approach to track student progress toward learning, provide immediate feedback to inform classroom instruction, and guide teacher professional development. Data can also include detailed information on students’ social and behavioral experiences, which can help instructors and students build stronger relationships and change the way children learn. Just as formative assessment can be used to improve students’ learning, tracking data on educator performance can be used to inform professional learning and development (Dillaha & Haren, 2017).
National and international level large-scale summative assessments are instrumental as monitoring and evaluation strategies and provide feedback and data on general trends and the state of the education system (World Bank, 2020; World Bank, 2019).
For any data to be effective at improving teaching and learning outcomes, they must reach the proper personnel, or those who can make and enforce decisions and take action. As shown in Box 2, each education decisionmaker has a different role in determining the ultimate outcomes of student learning—from the national or ministerial level and local government to school administrators to classroom or non-center-based instructors/coaches, to children and their parents/families. Furthermore, for data-informed decisionmaking to take place, it is not enough for stakeholders to have access to the data—they also need to have the capacity, time, and authority to collect and use it. The following section discusses some of the factors that facilitate real-time data collection and use, as well as some of the potential pitfalls.
Data for whom in the education ecosystem?
Real-time data are valuable at all stages of the program lifecycle from design to implementation, and their analysis can drive both immediate operational adaptations at the frontline of educational instruction by teachers, school administrators, and mentors, and at high-level tactical adaptations at a systemic level (USAID, 2017).
This adaptive management approach prioritizes “learning by doing” (Ramalingam et al, 2017), but by firmly relying on systematically collected data. Such adjustments can be either tactical—that is, targeting immediate operational processes—or strategic—addressing systemic shortcomings in the mechanics of the program itself. One well-cited example of this is the Educate Girls Development Impact Bond (Gustafsson-Wright, Osborne, & Massey, 2020), where a strong system of adaptive management was developed within the project, allowing for timely course correction and ultimately a positive impact on student outcomes.
Broadly, government administrators (in education ministries and subnational ministries) use education data for policy design and strategic planning. This may include monitoring national, subnational, or school-level attendance, attainment, and achievement levels, as well as measures of equity. This information feeds into decisions about allocation of resources and development and revision of standards and goals. It may also include decisions around the employment and training of administrators, teachers, and other staff.
At the school administrator level, education data are used to track, evaluate, and support student, teacher, and staff performance and progress. These data can also be used to develop school action plans and guide-school level practices.
Instructors and coaches use education data to assess the performance, progress, and needs of students in order to develop and revise classroom instruction. These data can come through a variety of forms including formative and summative assessments.
Source: Author adaptation based on Gill et al. 2014 (Mathematica).
Principles and pitfalls of real-time data collection and use
The academic literature identifies a number of principles that can help ensure accuracy, efficiency, effectiveness, and equity in the collection and use of data and that stakeholders are employing on the ground. The Right-Fit Evidence unit at Innovations for Poverty Action, for instance, works to implement the CART principles identified by Gugerty and Karlan (2018) to support data collection for monitoring and evaluation. According to these principles, data should be credible and actionable, data collection should be responsible, and findings should be transportable (IPA, n.d.). These principles also feed into the “nimble evaluation” approach—whereby data are quickly collected on short-term outcomes (Karlan, 2017)—which the Strategic Impact Evaluation Fund (SIEF) at the World Bank is currently testing (World Bank, 2018). USAID also outlines five key standards to improve the consistency and accuracy of collected data. These include validity of data, integrity of the data collection process, precision (or a small margin of error on performance indicators), reliability or rigor in analysis, and timeliness in using data in decisionmaking.
Some potential pitfalls are also highlighted in the literature. Specific to the education sector, for instance, Pritchett (2018) argues that efforts to collect real-time data must be grounded in a cohesive theory of change framework to avoid being overwhelmed with unstructured data and potentially lose sight of the larger picture of child well-being. In other words, because education systems tend to be non-linear and interactive, understanding causal connections between different inputs is essential to making sense of real-time data. Another potential pitfall is that real-time data can create an illusion of information if decisionmakers are unable to detect relevant trends from the noise generated by continuous tracking in a complex environment. For example, across four inventory management experiments, Lurie et al. (2009) found that when provided with real-time data, managers focused asymmetrically on the most recent data and failed to adequately compare data from multiple time periods.
Drivers of successful data collection and use
There are a number of potential drivers that can facilitate or hinder the collection and use of data. These can be split broadly into three categories: capacity, logistics, and incentives. The capacity category includes understanding which data are relevant for responsive decisionmaking and when they should be collected, the ability to analyze data and apply data-driven insights to teaching practices and support, and the ability to act on data. The logistics category includes practical issues around data collection and analysis, such as the tools used to collect and analyze data and the format in which data are accessed or displayed. In the final category, incentives are related to the intrinsic or extrinsic motivation to collect and analyze data and apply the findings (Author adaptation from multiple sources including USAID, 2010; Gugerty & Karlan, 2018; Gill et al., 2018, and Kaufman et al., 2022).
FIGURE 2

Furthermore, these categories can interact with one another. Research on data usage finds that instructors are more likely to use data when schools develop a culture of data use or when there is support, training, time, and/or systems in place for data use. For instructors, data timeliness, perceived validity, and capacity for instructional adaptation all affect self-reported data use; instructors are most likely to use formative data to learn about new students, group students for instruction, and assess weaknesses and strengths at the class level (Tyler, 2011).
This study focuses on one aspect of the data ecosystem: the tools to collect and analyze data—specifically, real-time data for education. A comprehensive deliberation of this category requires that we also take into account other factors mentioned under the costs, incentives, and capacity associated with the process of turning data into decisions. Limited exploration of these factors aside, we restrict ourselves to a detailed description of the nature of digital tools developed for use in education systems. This includes, for example, “how to collect the data” and “how to analyze the data” in the capacity category and “cost of data collection” and “analysis and application” in the incentives category. The other drivers listed above are outside the scope of this study, as are attempts to analyze whether real-time data and/or the factors associated with their collection and use have any impact on learning outcomes. While related and of interest, such literature should be seen as complementary to this report and framework. In the following sections, we provide a brief overview of the tools for data collection before zooming in on digital tools for collection and analysis of real-time data.
Tool typology
Tools to collect data can take many forms, ranging from a simple pen and paper survey to the more current technologies that can collect data remotely on and offline—for example, using social media like WhatsApp and Facebook. In low- and middle-income countries in particular, education data have historically often been collected manually and on paper. The lack of standardization of the data pipeline, susceptibility to human error make it more challenging to analyze and/or use this data to change an intervention. However, in recent years, a boost in the availability, affordability, and accessibility of technology—and education technology specifically—has led to an increase in the digitization of data collection globally.
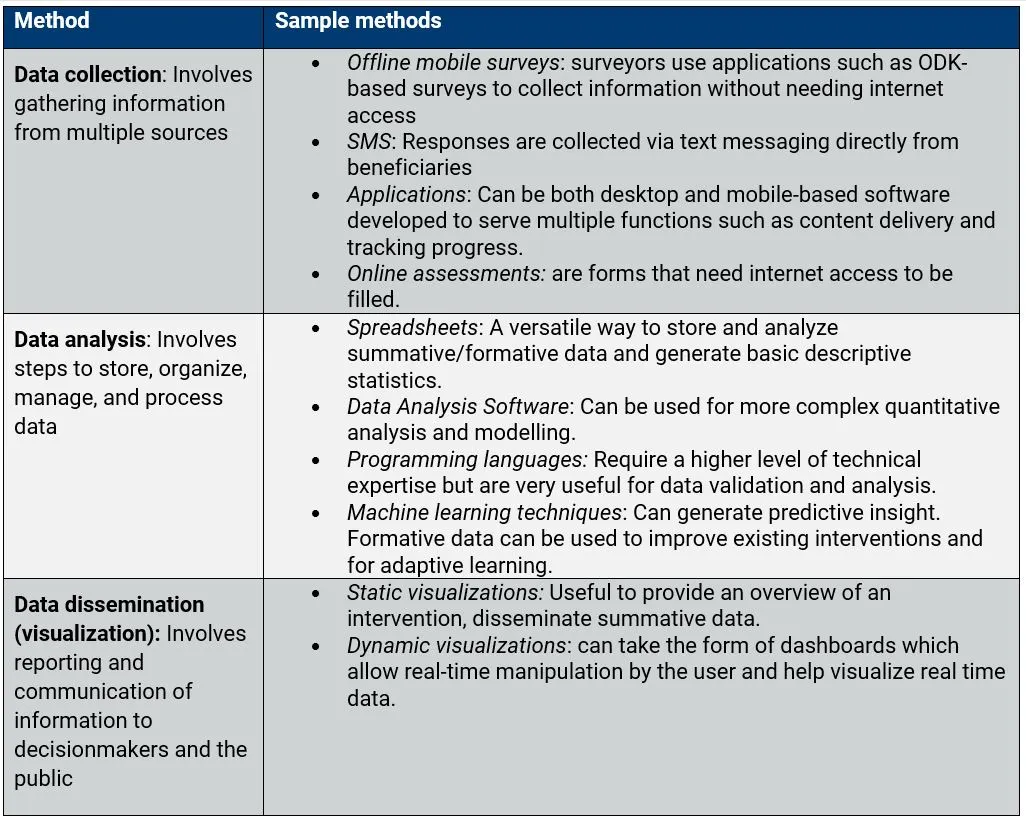
Digital technologies can be used at different stages of the data life cycle, starting from data collection to analysis and dissemination of results to decisionmakers. Digital tools may use different approaches to carry out these functions, depending on the context for which they are designed. The following Table 2 is an indicative, non-exhaustive list of the methods generally used to collect, analyze, and disseminate data (Author adaptation from USAID, 2021).
TABLE 2. Broad methods to collect, analyze, and disseminate data
In high-income countries in particular, the use of digital tools is commonplace; instructors, administrators, and families typically have access to this information via dashboards, allowing them to track student participation and progress, and identify where students need additional support. Historically, due to various constraints (lack of access to technology, software, and internet, as well as limited capacity) in lower-income countries, there are fewer of these technologies available or utilized. However, as the demand for real-time data increases, their use is expanding rapidly.
Digital technologies have an increasing presence in many components of the education system and offer the potential to transform the management of education systems to overcome geographic disparities, personalize learning, and make information available in digital forms (West, 2012). Digital technologies can also specifically support instructors with teaching and reach: engaging with learners in new ways; broadening access to learning materials; reducing administrative burdens; and creating tools for formative and summative assessment (Trucano, 2013). Furthermore, data digitalization enables “closed-loop” experimentation which allows for iterative impact evaluation of an intervention (Kaufman et al., 2022).
Real-time data systems can range across the spectrum of digital technologies—from those that depend on face-to-face surveys and observations to sensor-based automated computational systems that rely on web- or application-based tools for computers, tablets, and phones (smart and basic feature)—for collection, sharing, managing, and reporting data (GIZ, 2017). Integrating more complex digital data systems into education practice requires robust infrastructural support, along with training of personnel involved in the data collection and use (The Economist, 2021).
Innovation in development and application of technology for education has led to remarkable progress. However, it has also led to a crowded field in which many innovations are unnecessarily recreated due to lack of knowledge of their existence, and digital tools are no different.
These requirements often put the sustainable use of digital tools outside the capacity of decisionmakers operating in resource-strained environments. COVID-19 has made an internet/power connection essential to accessing education and has raised concerns whether technology actually reaches the students who need it the most. Globally, 1.3 billion children in the age group 3-17—two-thirds of this population—do not have access to the internet at home. Low-income countries bear the brunt of this digital divide: Only 1 in 20 school-going children in low-income countries have an internet connection at home, while in high-income countries, 9 out of 10 children have internet access. Even within low-income countries, rural areas are disproportionately less likely to have a reliable internet connection (UNICEF, 2020). Access to energy also is similarly inhibited along income and geography lines, with 759 million people living without electricity. While the number of people without electricity is slowly decreasing in the majority of the world, in sub-Saharan Africa, this number increased for the first time in six years. Digital tools must be designed to be resilient to the challenges posed by difficult settings in order to be inclusive and equitable.
With the growing global focus on continuous measurement and adaptive management, many programs are seeking to design intricate data and accountability systems that often hinge on bespoke data collection technologies. Innovation in development and application of technology for education has led to remarkable progress. However, it has also led to a crowded field in which many innovations are unnecessarily recreated due to lack of knowledge of their existence, and digital tools are no different. To aid selection of tools by decisionmakers, in the next section of this report, we categorize tools into a typology based on their functions and purposes.
Typology
Multipurpose tools across different education settings can simultaneously collect data on learner performance or analytics in the background while the tool is in use. Given the overlapping functionalities and many different purposes or goals of tools, we created a typology of tools and breakdown of their various functions, as well as why one might choose a certain tool based on in-depth surveys. For a detailed description of the research methodology and survey instrument, please see the Appendix.
Since there are many other types of digital education technology tools available, such as tools for communications, collaboration, and/or education administration that are not as relevant to real-time data collection for education sector or program performance, they are excluded from this typology.
Along with data collection, many of the tools we surveyed had features related to data analysis and dissemination using technology such as offline surveys, data analysis software, etc. listed earlier. Through inductive research, we have also included a third, often related, type of tool which specializes in adaptive content delivery, and may also employ technology used for data collection, analysis, and learning.
Functions
- Data collection: Broadly speaking, these are tools that collect data, which may include inputs into the tool (e.g., entered by tool user) or data collected as users interact with a program or application (i.e., data collected passively on the backend of an educational app).
- Data analysis and visualization: These are tools with analysis and visualization capacities based on the collected data, such as calculations, graphs, and more, which could come in the form of a dashboard, for example.
- Learning content delivery: These tools deliver educational or training content, such as guided instruction or games, to the tool user who may be a student or an instructor. They may also assist instructors in adapting and improving instructional practices.
In practice, tools can have multiple functions at once, and it is the combinations of these functions that help to determine the larger purpose and goal of the tool. For the purposes of our research, we have narrowed in on four permutations of these functions and therefore classified results in four main permutations of typologies, or “types” of tool purposes, as shown in Figure 3 below. In the next section, we elaborate on each type and provide an illustrative example.
It is also the case that what appears to the user as a single tool may in fact be multiple lower-level methods and applications integrating into one unified system or platform for the user. For example, the World Bank’s Teach platform utilizes SurveyCTO for its digital application. Some tools may include multiple underlying systems for different types of data collection, which may be analyzed and presented together as a dashboard for program monitoring. For the purposes of this study, our typology considers both the individual applications and the integrated platforms to be “tools” for real-time data collection.
FIGURE 3
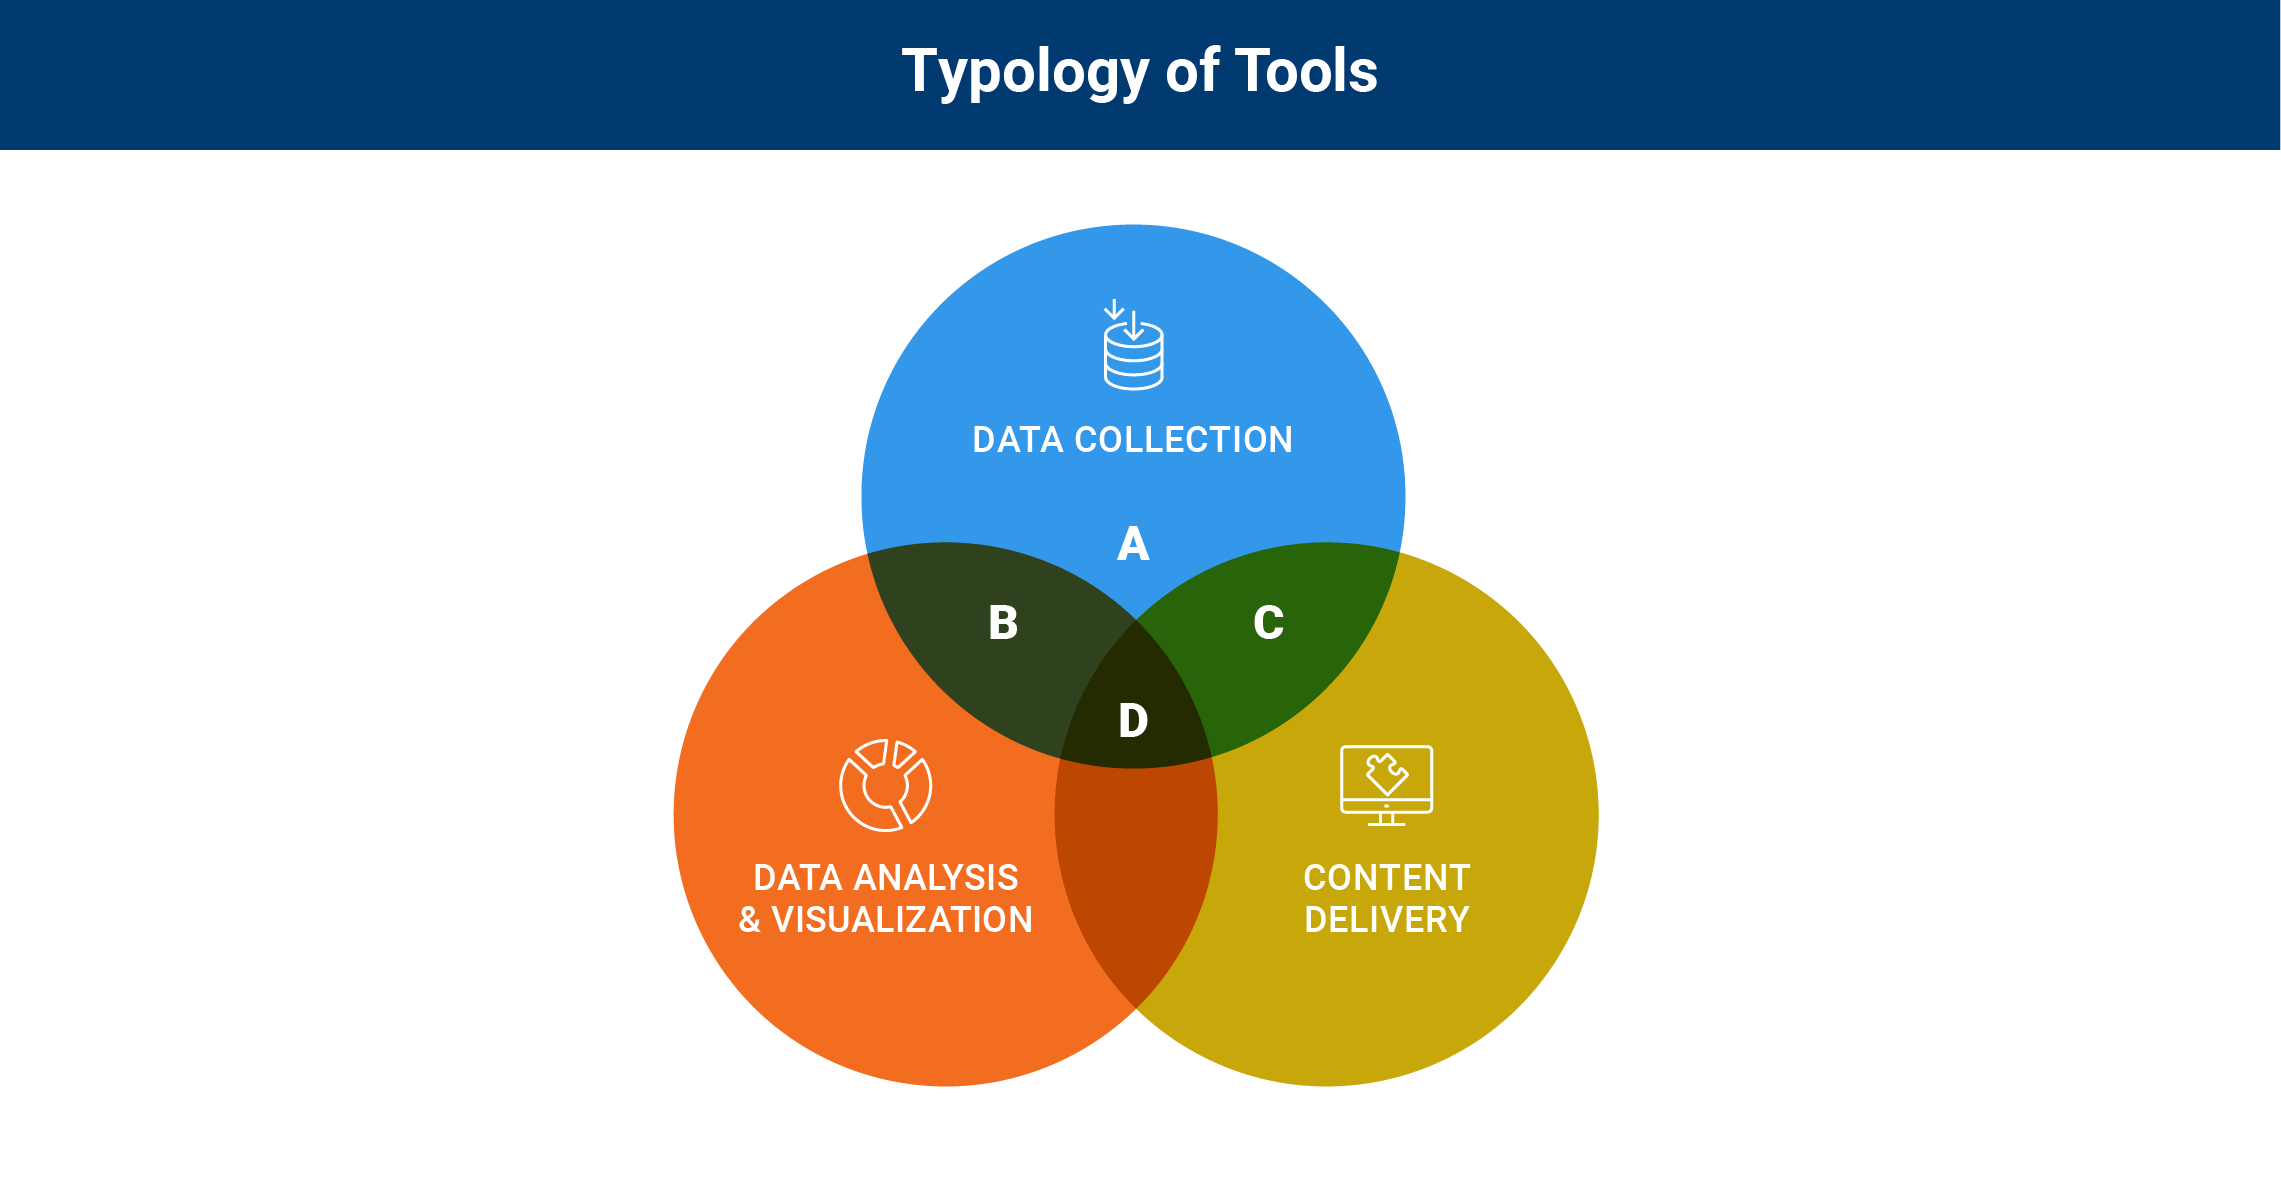
Type A: Data collection
Purpose: These tools collect and store data that are likely to be analyzed with an external statistical program or spreadsheet application. The data could be used to track attendance, administer assessments, deliver household or individual surveys, conduct classroom observations, or more. They differ from other types of tools in that they do not have analysis or content delivery features, but they could be linked or integrated with other tools and systems that do possess these features.
*Note: In our survey, we did not come across a tool that performed the sole function of data collection. This type of tool may have been more common in earlier stages of the digitization process, whereas more sophisticated recent tools often have analysis functions embedded within.
Type B: Data collection + analysis and visualization
Purpose: These data collection + analysis and visualization tools (Type B) collect and store data, and also provide data analysis and visuals of the result. These could be more complex surveys or observational, formative, or summative assessment tools for children or instructors, school or classroom management, and more. The data collected can then be analyzed or visualized (often automatically), for example in the form of an integrated dashboard, and likely would be used for program monitoring and evaluation activities, such as identifying trends, measuring progress, and/or devising potential ways to address challenges.
Example: Waliku is a suite of digital tools for student learning and well-being. Along with tracking enrollment and attendance for more than 30,000 students in Indonesia and Guatemala, it also records health metrics to aid child welfare management.
Type C: Data collection + learning content delivery
Purpose: These tools (Type C) usually function as game-based education technology applications, student learning platforms, or as a lesson/pedagogy delivery tool aimed at instructors or school leaders. With the included data collection functions, these tools are geared toward gaining a deeper understanding of the tool’s usage and users. Content delivery is usually the primary function of these tools, and could include educational content targeted at learners, instructional or coaching content targeted at instructors, family engagement content targeted at caregivers, or others. The data collected alongside content delivery are nearly always collected automatically.
Example: Chimple is an open-source mobile application for children to learn mathematics, reading, and writing in informal environments without instructor supervision. It features an adaptive learning algorithm and a gamified environment to facilitate dynamic learning.
Type D: Data collection + analysis and visualization + learning content delivery
Purpose: These tools (Type D) are typically quite similar to Type C, but with the addition of data analysis and visualization, these applications can provide a one stop shop for delivering content for interventions, as well as measuring impact and presenting that data to decisionmakers in real time. These are typically more complex system-level tools that address the holistic engagement of students, learners, and education systems, and may include education technology applications with adaptive learning capabilities.
Example: Tangerine is an open-source tool that was previously used primarily for offline, oral student assessment and timed data collection required for early grade reading and math assessments. It has evolved to include content delivery through its “Teach” and “Coach” applications.
We have sought to establish a clear framework for understanding and evaluating existing tools, so that decisionmakers can anticipate features that their program might need and what tools may be available to fit these needs, thereby better utilizing limited funding.
Due to a crowded field and lack of clear understanding of what tools are available and how they function, education decisionmakers may have a difficult time identifying existing tools that meet their needs. We noticed the lack of a cohesive framework outlining considerations that might help decisionmakers identify an appropriate digital tool for a given purpose, especially for use in low- and middle-income countries. Thus, we have sought to establish a clear framework for understanding and evaluating existing tools, so that decisionmakers can anticipate features that their program might need and what tools may be available to fit these needs, thereby better utilizing limited funding.
Tool selection criteria
In addition to considering the above typology, there are many other factors to consider when selecting or developing a digital tool for real-time data collection in education. These considerations can range from highly contextual to broadly purposed goals, and can cover everything from programmatic structure or goals to the limitations of the physical environment. For example, some tools are focused on early childhood years, others are more open-ended, some are available only in certain languages, and still others are suitable (or not) for low-power or internet contexts.
These elements all come together in the evaluation of a program or organization’s needs for data collection. As depicted in Figure 4, we evaluate these considerations across three main categories: functions, usability, and context.
FIGURE 4
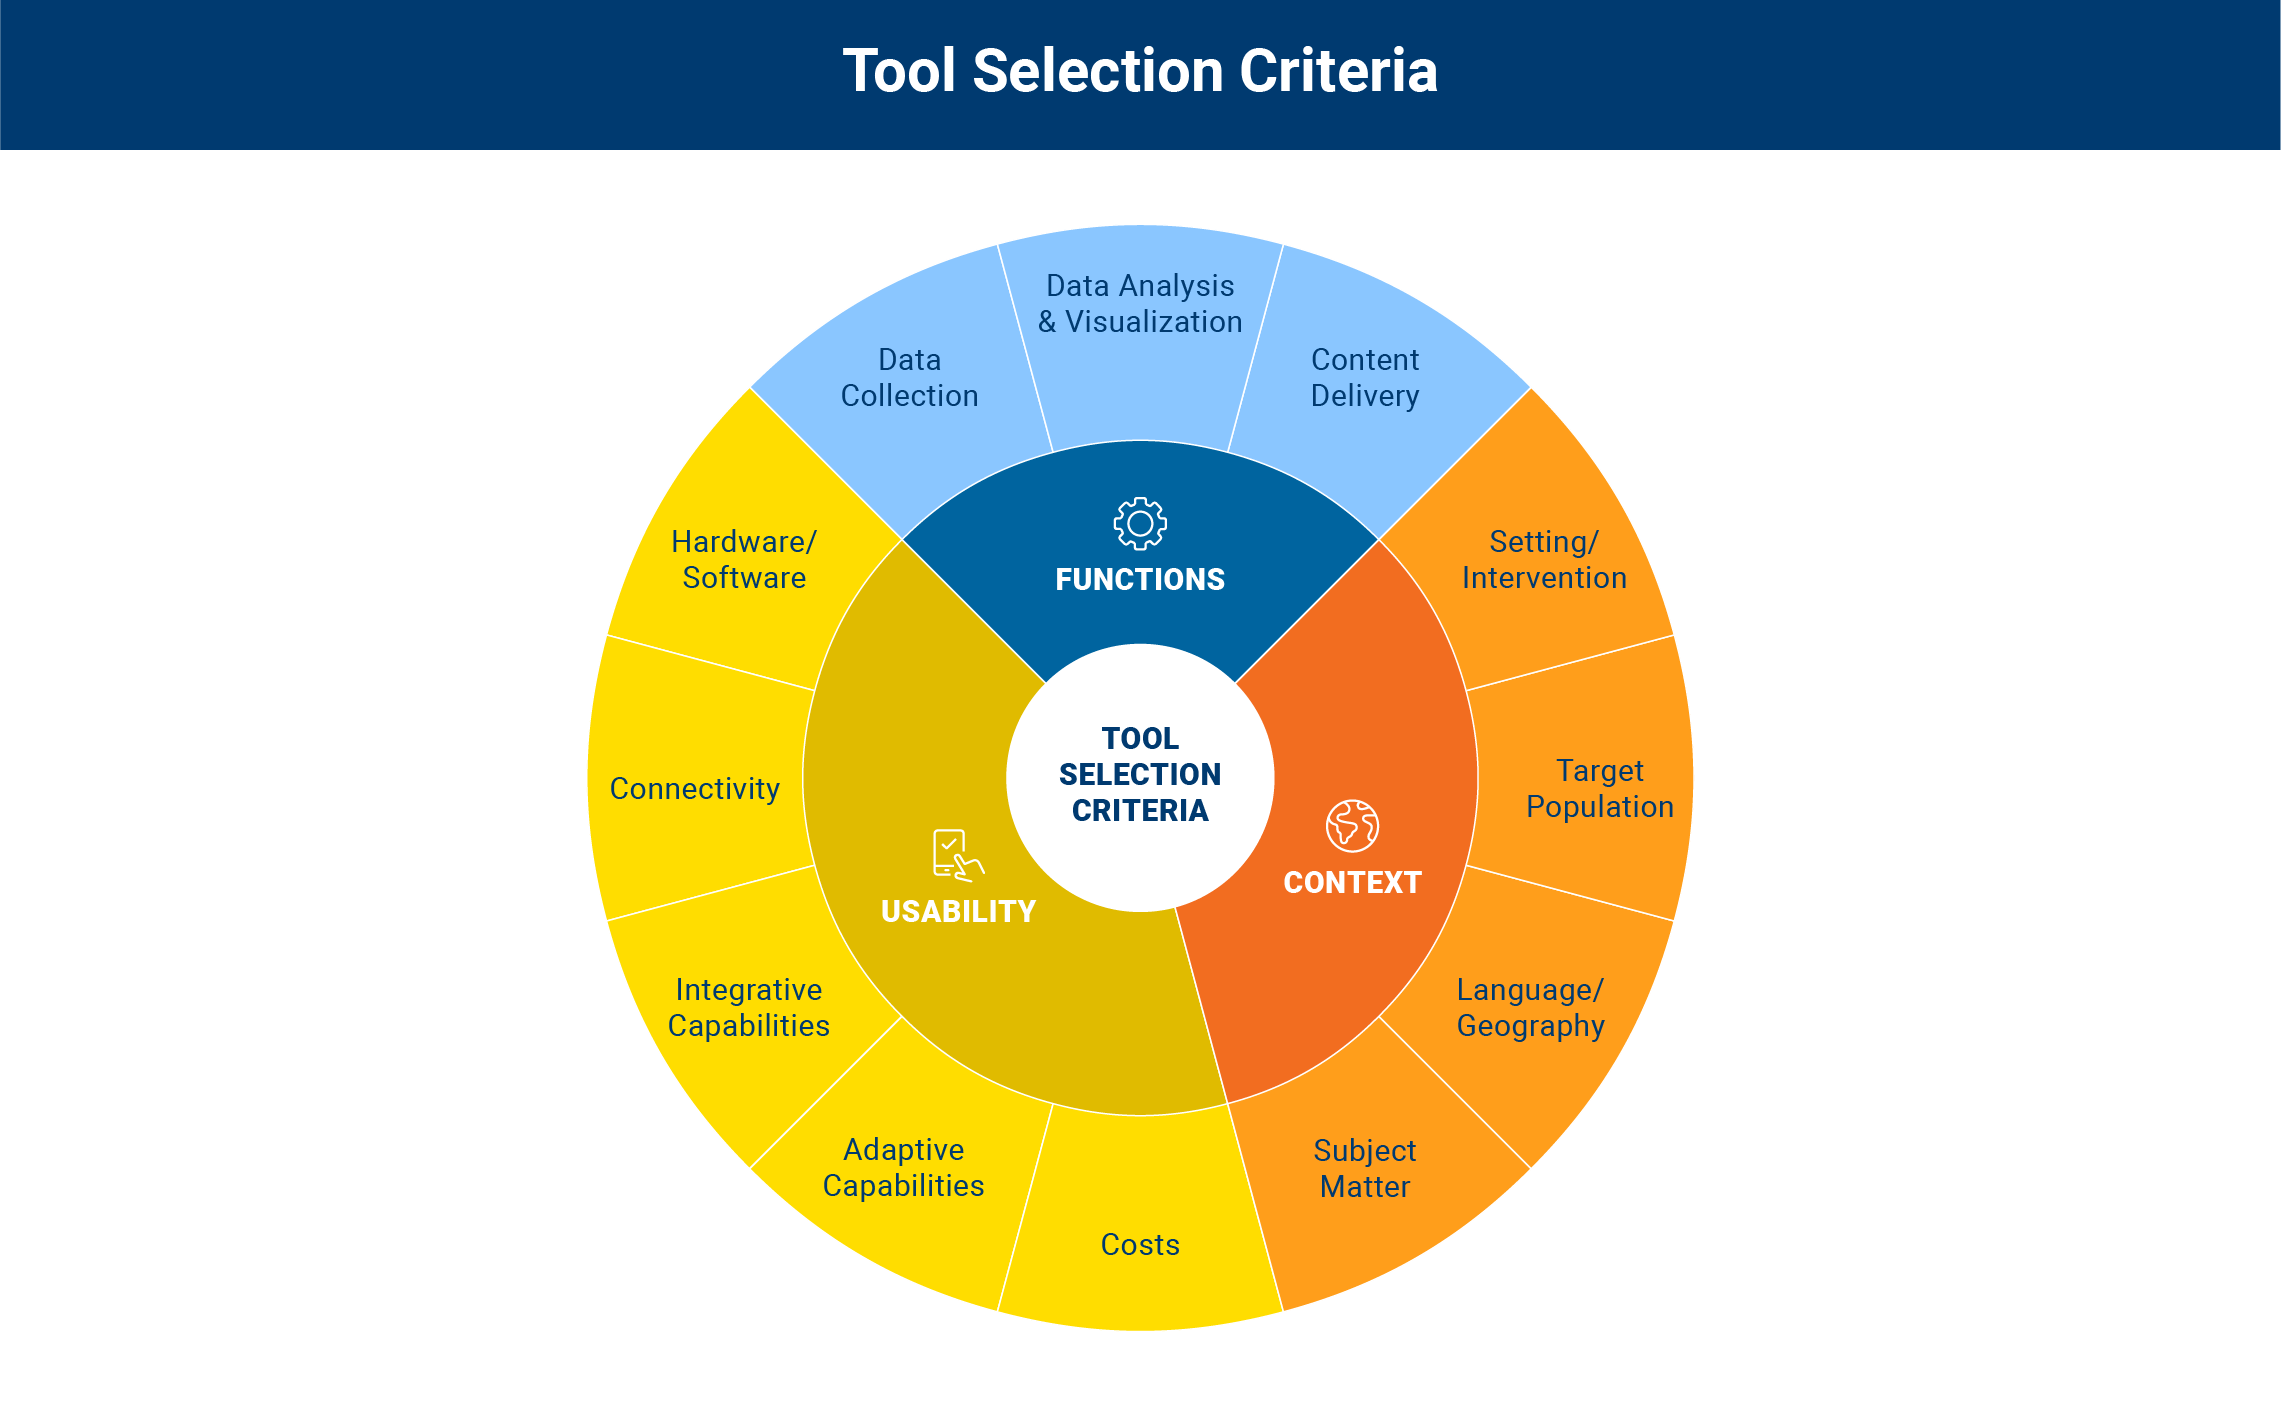
There are a number of sub-elements in each of these categories, related to their varied features and applications, which can make them better or less suited for particular uses. These sub-elements were based on a survey that we administered to tool developers (see Appendix for further details), and examples of tools from this survey administration can be found in our interactive Tool Finder database.
The components and sub-components are summarized in Table 2 below, and further described in the section which follows.
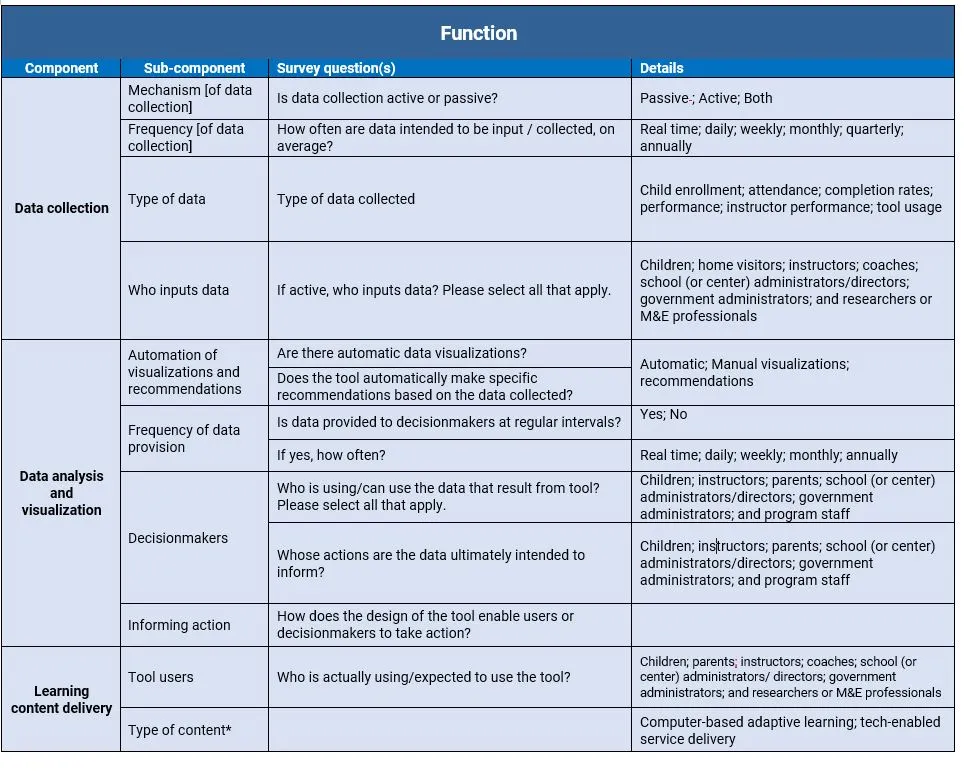
TABLE 3. Detailed selection criteria for digital tools
Selection framework
This section describes the various categories of consideration and how they may influence the selection of a tool. To view tables of our sampled tools across these different categories, please see the Appendix.

Functions
As described in the previous section, the primary typology of tools includes their functions for data collection, data analysis and visualization, and learning content delivery. However, each of these three elements also have sub-components contained within them, which may impact tool selection.
Data collection: When we think of data collection, one of the first considerations for decisionmakers is what data are being collected. While this can vary greatly across different tools and designs, we can often think of this data in terms of what it measures, in the categories of student (child) or provider (instructor) data, and whether they include enrollment, attendance, completion rates, performance (self or externally assessed), or usage information. This data could be in the form of assessments (typically formative), classroom observations, or enrollment/attendance trackers.
Another important consideration is how a tool collects data, which provides a lot of information about how the tool functions. This can primarily be thought of as active data collection, in which a user is interfacing with the tool to enter information (such as a survey), or passive (such as when the tool automatically collects data while it is functioning, as with application analytics). Furthermore, active data collection could be through self-administration (such as a self-reporting questionnaire) or external administration (such as a proctor-delivered assessment). Whether passive or active, data can be collected (or intended to be collected) at different periodic frequencies (e.g., daily, weekly, monthly, quarterly, annually, or at beginning/end of the program) or in real time.
Directly related to the how and what is who is collecting the data and who is using it. In contrast to passive tools, which collect data automatically, active tools could be administered by instructors, coaches, school or center administrators, researchers or M&E officials, families, or children. These data —in either individual or aggregate format—are often used by decisionmakers at different levels of the education system, ranging from parents and families to instructors and school officials, to INGO or research/evaluation staff, to government officials at local or national levels.
Data analysis and visualization: The goal of data in this format is often to inform the action of decisionmakers (such as instructors, practitioners, and families), and analyzing and visualizing data is often key to achieving that outcome. These decisionmakers can occupy any level of the education system, including students, parents, instructors, school leaders, program staff, or government officials, and their actions can be informed through a number of different approaches. Dashboards are a common feature of such tools, where real-time and aggregated data are presented to track program or learner status and identify strategies for further action.
While the format of the analysis and output can take many forms, one important function is their automation and level of user input. Some tools provide (or have the ability to provide) automatic data analysis, visualizations, and / or recommendations across a set of predetermined metrics that the tool designers or users can set themselves, including intervals (such as daily, weekly, monthly, quarterly, or annually). Other tools provide data analysis, visualizations, and/or recommendations with the input or manipulation of the user; while this approach may not be as quick as automatic recommendations, it may allow the user more insights into which data to consider and how—questions which may only emerge once the data are collected. Whether automatic or manual, data analysis and recommendations can be provided at various time intervals—from real time / continuous to annually.
Learning content delivery: This includes tools designed to deliver content to users—often students or instructors—and then gather data in the background—often passive data about the tool use or user performance. This may include a wide range of functions—for example, child-focused, game-based learning / education applications, tools which focus on tech-enabled lessons / content delivery (e.g., synchronous or asynchronous virtual lessons), or computer-based adaptive learning.
Since the focus of our research is on tools that contribute to data analysis, we do not seek to further categorize types of content delivery programs. Instead, we direct readers to the wealth of resources on education technology, such as the Brookings education-technology playbook.

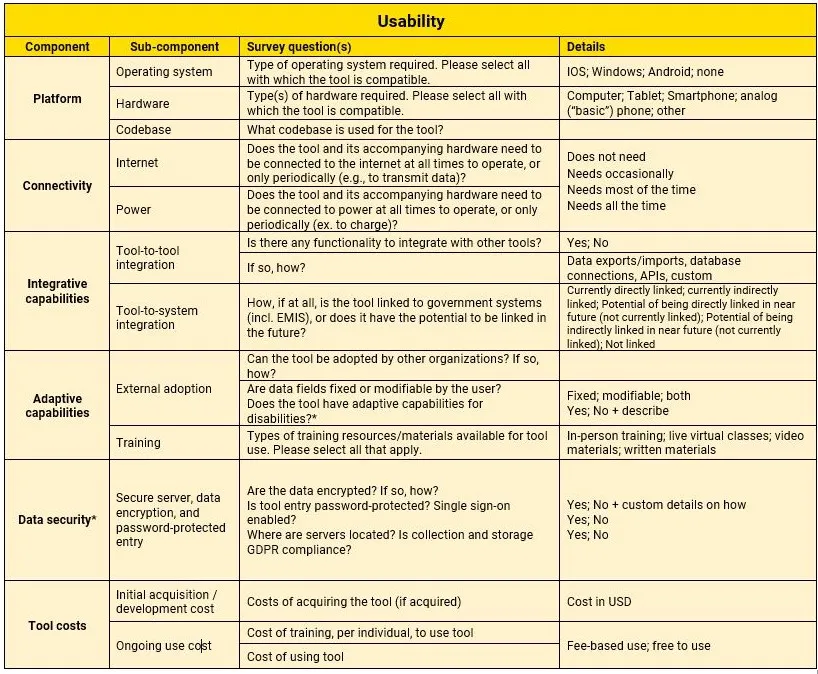
Usability
There are numerous usability considerations for specific programmatic needs and contexts, which can aid in determining which tools are best suited.
Platform: The platform that deploys a digital tool can play a significant role in determining its selection. This may include the tool’s codebase, as well as the hardware (technology device), software (interface and program), and operating system with which the digital tool is compatible. Hardware refers to the tool’s compatibility with a tablet, computer, smartphone, and/or basic/analog phone, while the operating system may be designed for Android, iOS (Apple), Windows, and/or other software.
Connectivity: Different tools and their accompanying hardware require different power and internet connectivity functions to operate, which may be particularly relevant for a given context. Power and internet connectivity could be needed at all times, only occasionally (such as for charging or for data transmission), or not needed at all for the operation of the tool.
Integrative capabilities: Tool integration can primarily be viewed in two dimensions: integration with other tools and integration within existing systems—both of which can be critical to effective uptake and usage. Tool-to-tool linkages can be configured in different ways, including database exports and imports, database connections, and APIs, or they can be customized. Tool-to-system integrations, such as with education management information systems (EMIS), can be direct or indirect and may be possible functions even if not currently utilized in that way.
Adaptive capabilities: Adaptive capabilities are one of the most important considerations when looking to adopt an existing tool. These include whether the tool can be updated or customized in a general sense, as well as whether the user can modify specific fields or settings. In addition, some tools may need periodic maintenance and upgrades, which may impact their capacity for adaptation. Another important consideration of adaptive capabilities is whether and how much training is available and / or required of users. This aspect may also encompass a tool’s adaptability to different types of user needs, including potential disabilities.
Data security: Data security is a key concern of many seeking to utilize tools for data collection. This could include those related to software, such as encryption of the data (and how), protections available, and who has access and how, as well as geographic or political considerations. This can also relate to the geographic location of the servers, whether the tool and/or data storage are GDPR compliant, and whether or not the tool is open source.
Tool costs: When considering the use of an already existing tool or building a custom tool, cost can be a key consideration. The cost of developing new tools can range widely but does run quite high. While adapting or adopting an existing tool is typically much less expensive, there are important factors to consider, such as the cost of use or licensing by another organization, the cost of ongoing tool maintenance, and the cost of training tool users. Some tools offer various options, which can impact cost; open-source solutions, for instance, are typically “free” to install on one’s own server and manage there (but could incur a cost for server backup space), as well as have software-as-a-service options, which include a fee for use.

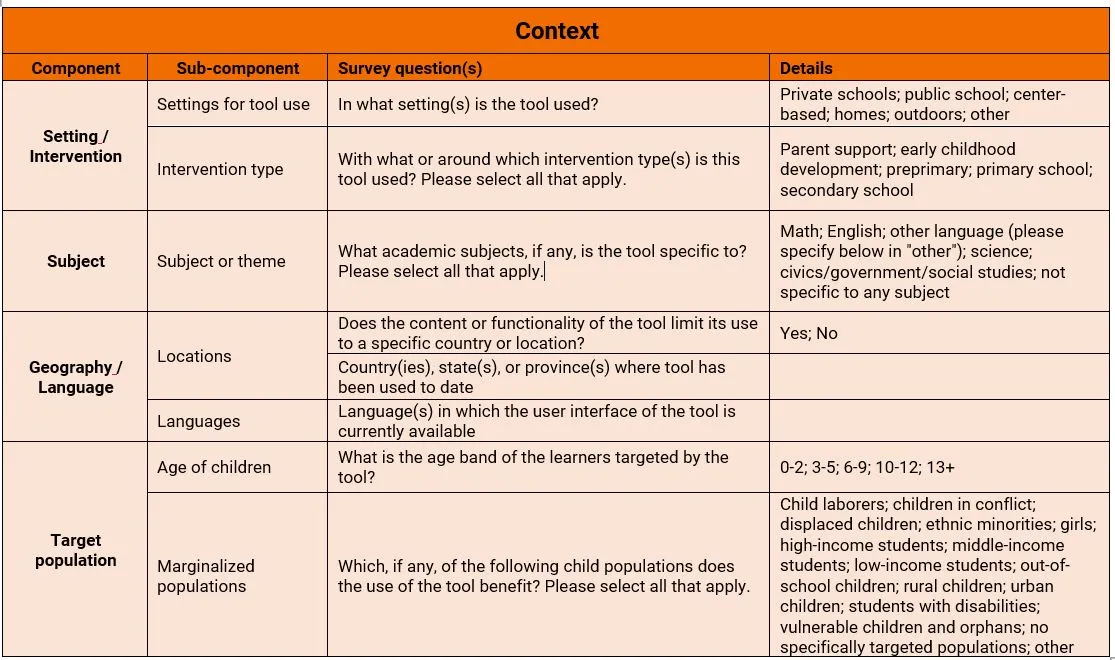
Context
Some tools are developed for specific locations or contexts, which may enable or restrict their use for some applications or cases. While it can be useful to consider the contexts for which a tool was developed or how it has been used in the past, it is also important to keep in mind its adaptability, as an investment in adaptation may make a tool suitable beyond its current use or design.
Setting/intervention: The tool may have been developed or only used thus far in specific settings or interventions. The interventions could include, for example, primary or early childhood education and could be targeted at parent support, early childhood development, preprimary, primary, or secondary school. The settings of these tools may be directly related to the type of intervention, such as at schools (public or private), care centers, or home. Given the importance of different data for each of these settings or interventions, some tools may be better suited for a specific program or use.
Target population: Certain populations have specific needs that could be well suited to a tool’s design. This could include the age of the children, as well as other characteristics, such as gender (tools with data disaggregation functions) or children with disabilities. In addition, some tools may be well suited to other contexts, in particular crisis and conflict settings, which have specific needs to consider in terms of tool functionality.
Geography/language: A key constraint for tool adoption could be the language(s) the tool interface and tool delivery have available. While translation may be possible, it is important to keep in mind cost considerations. Additionally, some tools may be more contextually appropriate to certain regions or geographies. Reasons for this may include cultural considerations of content (such as characters depicted and relevance of examples used), regional educational standards, and more.
Subject(s): Some tools for teaching and learning may have been developed thematically (such as social-emotional learning) or subject-specific (such as math and language). While it may be possible to expand tools to other subjects, it is important to keep in mind the cost considerations.
Decisionmakers, armed with rich contextual knowledge of their intervention and looking to use a digital tool, can use our framework to anticipate needs when they choose to adopt a new tool for their program.
Decisionmakers , armed with rich contextual knowledge of their intervention and looking to use a digital tool, can use our framework to anticipate needs when they choose to adopt a new tool for their program. It may also serve as a guide for those looking to develop their own tools from scratch, so that they can create original platforms that solve previously unaddressed problem areas. The interactive Tool Finder database complements the framework by identifying and providing details of digital tools that can help determine whether an existing tool can be adopted and/or adapted, or whether it makes sense to spend limited programmatic funding to develop a custom tool.
Conclusion
With the global education crisis and compounding challenges of COVID-19, it is now more critical than ever to make data-informed decisions toward achieving a range of equitable learning outcomes. Real-time data can help instructors, administrators, and even parents ensure that classrooms and learning spaces are managed adaptively to best serve learners. To accomplish this, it is necessary for data to be collected and presented: at the right time, with sufficient frequency, and to the right people in a way that is understandable and actionable.
For each of these elements, it is essential to have effective and efficient real-time data systems and tools. Such tools are available in a variety of forms, with many different features and purposes. In this report, we establish clear frameworks and criteria for appraising digital tools and understanding their key functions (data collection, data analysis and visualization, and learning content delivery) and we analyze the critical factors to consider when selecting or developing a tool.
Although digital tools may not be applicable for data collection in all contexts, especially in rural areas without power or internet, we highlight potential benefits of using digital tools for data gathering and analysis: timeliness, accuracy, dependability, cost effectiveness, and the ease of presenting and sharing data.
To ensure that the potential benefits of real-time data are maximized, stakeholders in the education sector could benefit from increased dialogue regarding data requirements, obstacles in their utilization, and data-driven learning decisions. Despite the importance, few countries have in place the policies, infrastructure, capacity, and/or tools required to generate regular and actionable performance data (World Bank, 2013). This is especially true for low-income countries, which stand to benefit the most from the implementation of robust systems to measure learning outcomes and a systems approach to education analysis. Future attention and research should focus on exploring these enabling factors, as well as on innovations in technology as the field evolves. It is our aim that this report, the frameworks provided within, and the accompanying interactive Tool Finder database can act as a valuable resource in understanding and taking better advantage of digital tools for real-time data collection as we continue to work toward ensuring that all children have access to quality teaching and learning experiences.
Download
Acknowledgments
We are grateful for the contributions to the research by Izzy Boggild-Jones, Paroma Mitra, Arushi Sharma, and Will Powers. In addition, we would like to thank Judith-Ann Walker and Emily Morris for their peer review of the report, as well as Katherine Portnoy for her editorial review. We are also greatly appreciative of Carmen Strigel and Abby Carlson for their thoughtful review of the research methods, survey and typology. In addition, we would like to thank the advisory panel members to this project who provided feedback in the early stages of the research: Ariam Mogos, Michael Trucano, Peter Blair, Zak Kaufman, Carmen Strigel, Abby Carlson, Chavaughn Brown, Nicolas De Borman, Sharath Jeevan, Rein Terwindt, Brian Komar, Elena Aria Sortiz and Sonja Giese. Finally, we are greatly to the respondents to our survey on digital tools for taking the time to fill in the survey and for their willingness to share the details of the tools.
The Brookings Institution is a nonprofit organization devoted to independent research and policy solutions. Its mission is to conduct high-quality, independent research and, based on that research, to provide innovative, practical recommendations for policymakers and the public. The conclusions and recommendations of any Brookings publication are solely those of its author(s), and do not reflect the views of the Institution, its management, or its other scholars.
Brookings gratefully acknowledges the support provided by the BHP Foundation.
Brookings recognizes that the value it provides is in its commitment to quality, independence, and impact. Activities supported by its donors reflect this commitment.
About the Authors