This explainer builds off of a May 2020 post, “Making Sense of the Monthly Jobs Report During the COVID-19 Pandemic.”
The unemployment rate soared from a 50-year low of 3.5 percent to 14.8 percent in April 2020 at the beginning of the COVID-19 pandemic, and then fell faster than many forecasters anticipated, to 6.3 percent in January 2021. But the labor market is far from healthy: for instance, the Bureau of Labor Statistics (BLS) counted 4.5 million more people as unemployed in January than were unemployed before the pandemic—and many more people weren’t counted as unemployed because they’d stopped looking for work. Here’s a guide to various measures of the health of the labor market.
What does the unemployment rate measure?
The headline unemployment rate (known as U-3) measures the percentage of people over the age of 16 who aren’t working but are available and actively looking for work.
Where do the data on unemployment come from?
Data on unemployment are collected every month in the Current Population Survey (CPS), a survey of about 60,000 households, conducted by the Census and the BLS every month, which includes roughly 105,000 people ages 16 and older. The questions about unemployment refer to what people were doing during the week that includes the 12th of the month, known as the “reference week”—so the survey to be released on Friday, March 4, 2021 will cover the week of February 8, 2021. The CPS is referred to as the household survey, to distinguish it from the establishment survey, which counts the number of people on employer payrolls. (The latest tally of payrolls showed that as of January 2021, we have recovered 9.9 million of the 22.4 million jobs lost since the beginning of 2020.)
How are individuals in the monthly survey identified as being unemployed?
Respondents to the survey are first asked whether they worked during the week that includes the 12th of the month. Individuals are counted as employed if they did any work at all as a paid employee, if they worked in their own business, or worked without pay for at least 15 hours in a family business. People are also counted as employed if they were temporarily absent from work as a result of sickness, bad weather, vacation, a strike, or personal reasons. Such workers are classified as employed but absent from work.
Respondents who are not employed then are asked if they have looked for work in the previous four weeks and are available to work. If so, they are counted as unemployed. Respondents who did not work but are on temporary layoff from a job with the expectation that they will be recalled—as many furloughed employees are today—are counted as unemployed whether they looked for a job or not.
What’s the difference between being unemployed and being out of the labor force?
People who are not working and who don’t meet the criteria to be counted as unemployed are said to be out of the labor force. This category includes students, retirees, and those who stay at home to take care of family members. In addition, people who report wanting a job but who have not looked for work in the most recent four weeks are also considered out of the labor force. Between February 2020 and January 2021, 5.5 million people dropped out of the labor force, on net. At the same time, the number of people out of the labor force who said they wanted a job rose by 1.9 million.
Why is it hard to determine if people are unemployed in the COVID-19 pandemic?
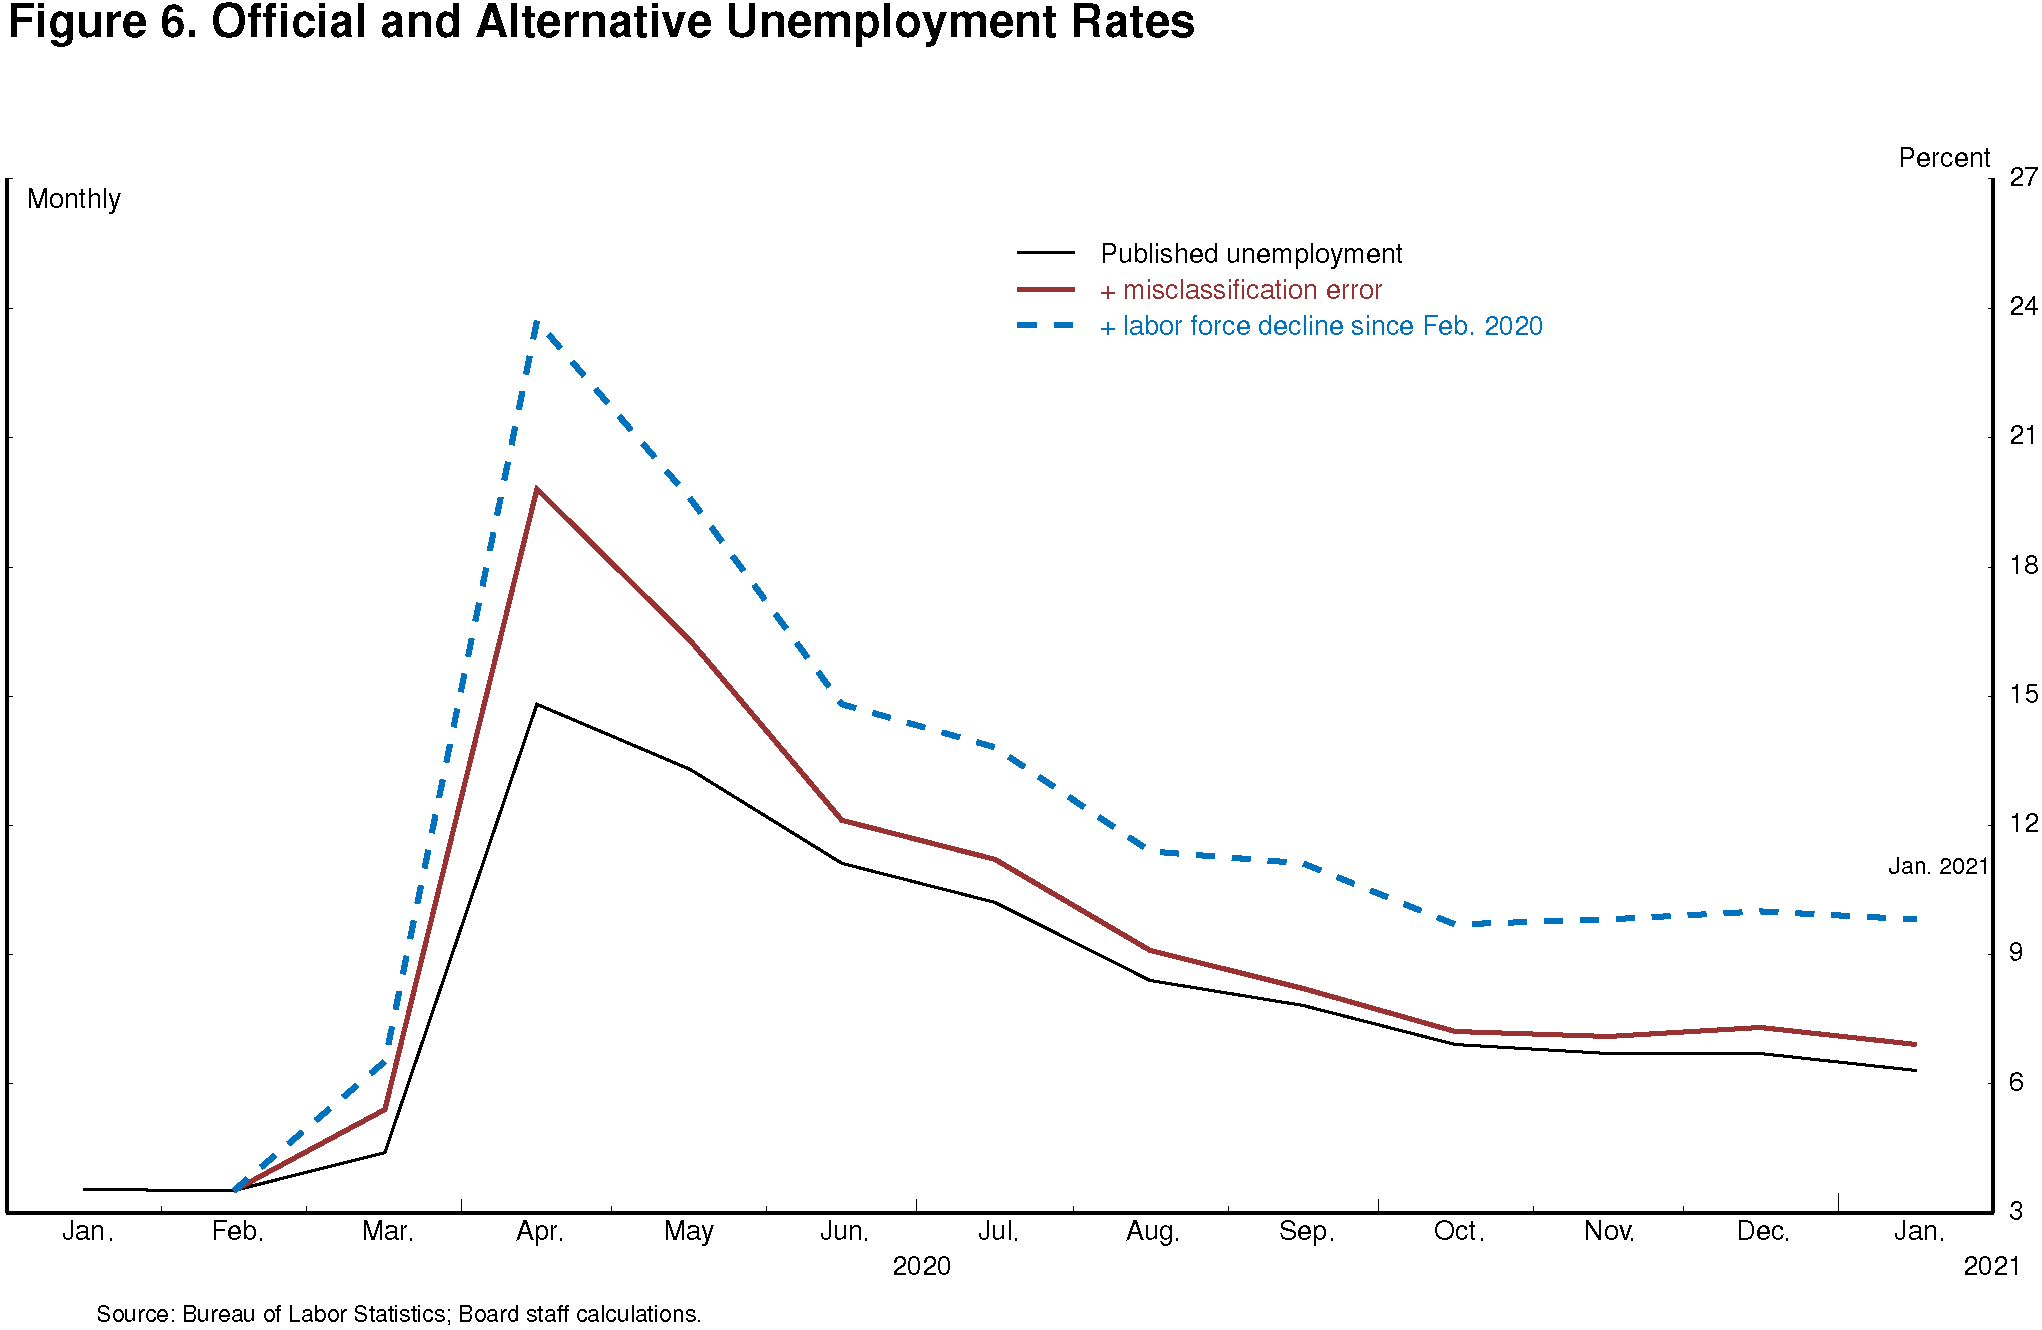
While the survey questions are the same as always, the nature of the COVID-19 economy means that people’s behavior, and hence the data, may not follow the same pattern that we usually see when the economy is turning down. For instance, early in the pandemic, the share of workers reporting themselves employed but not at work skyrocketed. While some of this increase was due to a rise in illness or childcare responsibilities, the number of people reporting themselves “not at work for other reasons” rose from around 600,000 prior to the pandemic to over 8 million. In conducting the survey, the BLS has attempted to categorize those employed but absent from work due to “pandemic-related business closures or cutbacks” as unemployed. Despite this effort, an unusually large number of workers in this situation have still been counted as “not being at work for other reasons,” which the BLS views as misclassification. Following its typical procedure, the BLS has categorized individuals reported as “not being at work for other reasons” as employed rather than unemployed. While this classification is in keeping with their standard practice, it has the effect of depressing the unemployment rate relative to a case where these workers are categorized as unemployed. That said, this misclassification is certainly less severe now than it was early in the recession: in January 2021, the number was 1.7 million. In addition, the BLS has publicly stated its estimate of the size of this mismeasurement. In January, the BLS reported that if misclassified workers had been counted as unemployed, the unemployment rate would have been 0.6 percentage points higher, or 6.9 percent. It also noted that this was an upper-bound estimate.
Among those who have lost jobs, the typical behavior would be to transition from employment into unemployment rather than to transition out of the labor force. However, early in the pandemic, with stay-at-home orders in place and nonessential businesses closed in many communities, people who left employment were much less likely to seek work than would typically be the case. In addition, schools closed in many places, which meant that many people who lost their jobs had child-care responsibilities that prevented them from seeking or accepting a new job. Even now, nearly a year into the pandemic, many of these same dynamics are in place. As a result, relative to a typical downturn, we expect the headline unemployment rate to be relatively lower than in a typical recession and the percent of those out of the labor force to be relatively higher, especially the percent of those who say they want a job but aren’t looking.
Indeed, we saw evidence of this in March 2020, when, relative to the prior trend, an additional 1.2 million people moved from employment to out of the labor force, and the number of people categorized as out of the labor force but wanting a job rose by 500,000. The resulting decline in the labor force participation rate was much larger than would be expected given the rise in the unemployment rate, and it remains unusually low.
Given the limitations of the unemployment rate as a measure of labor market slack, what are some alternatives?
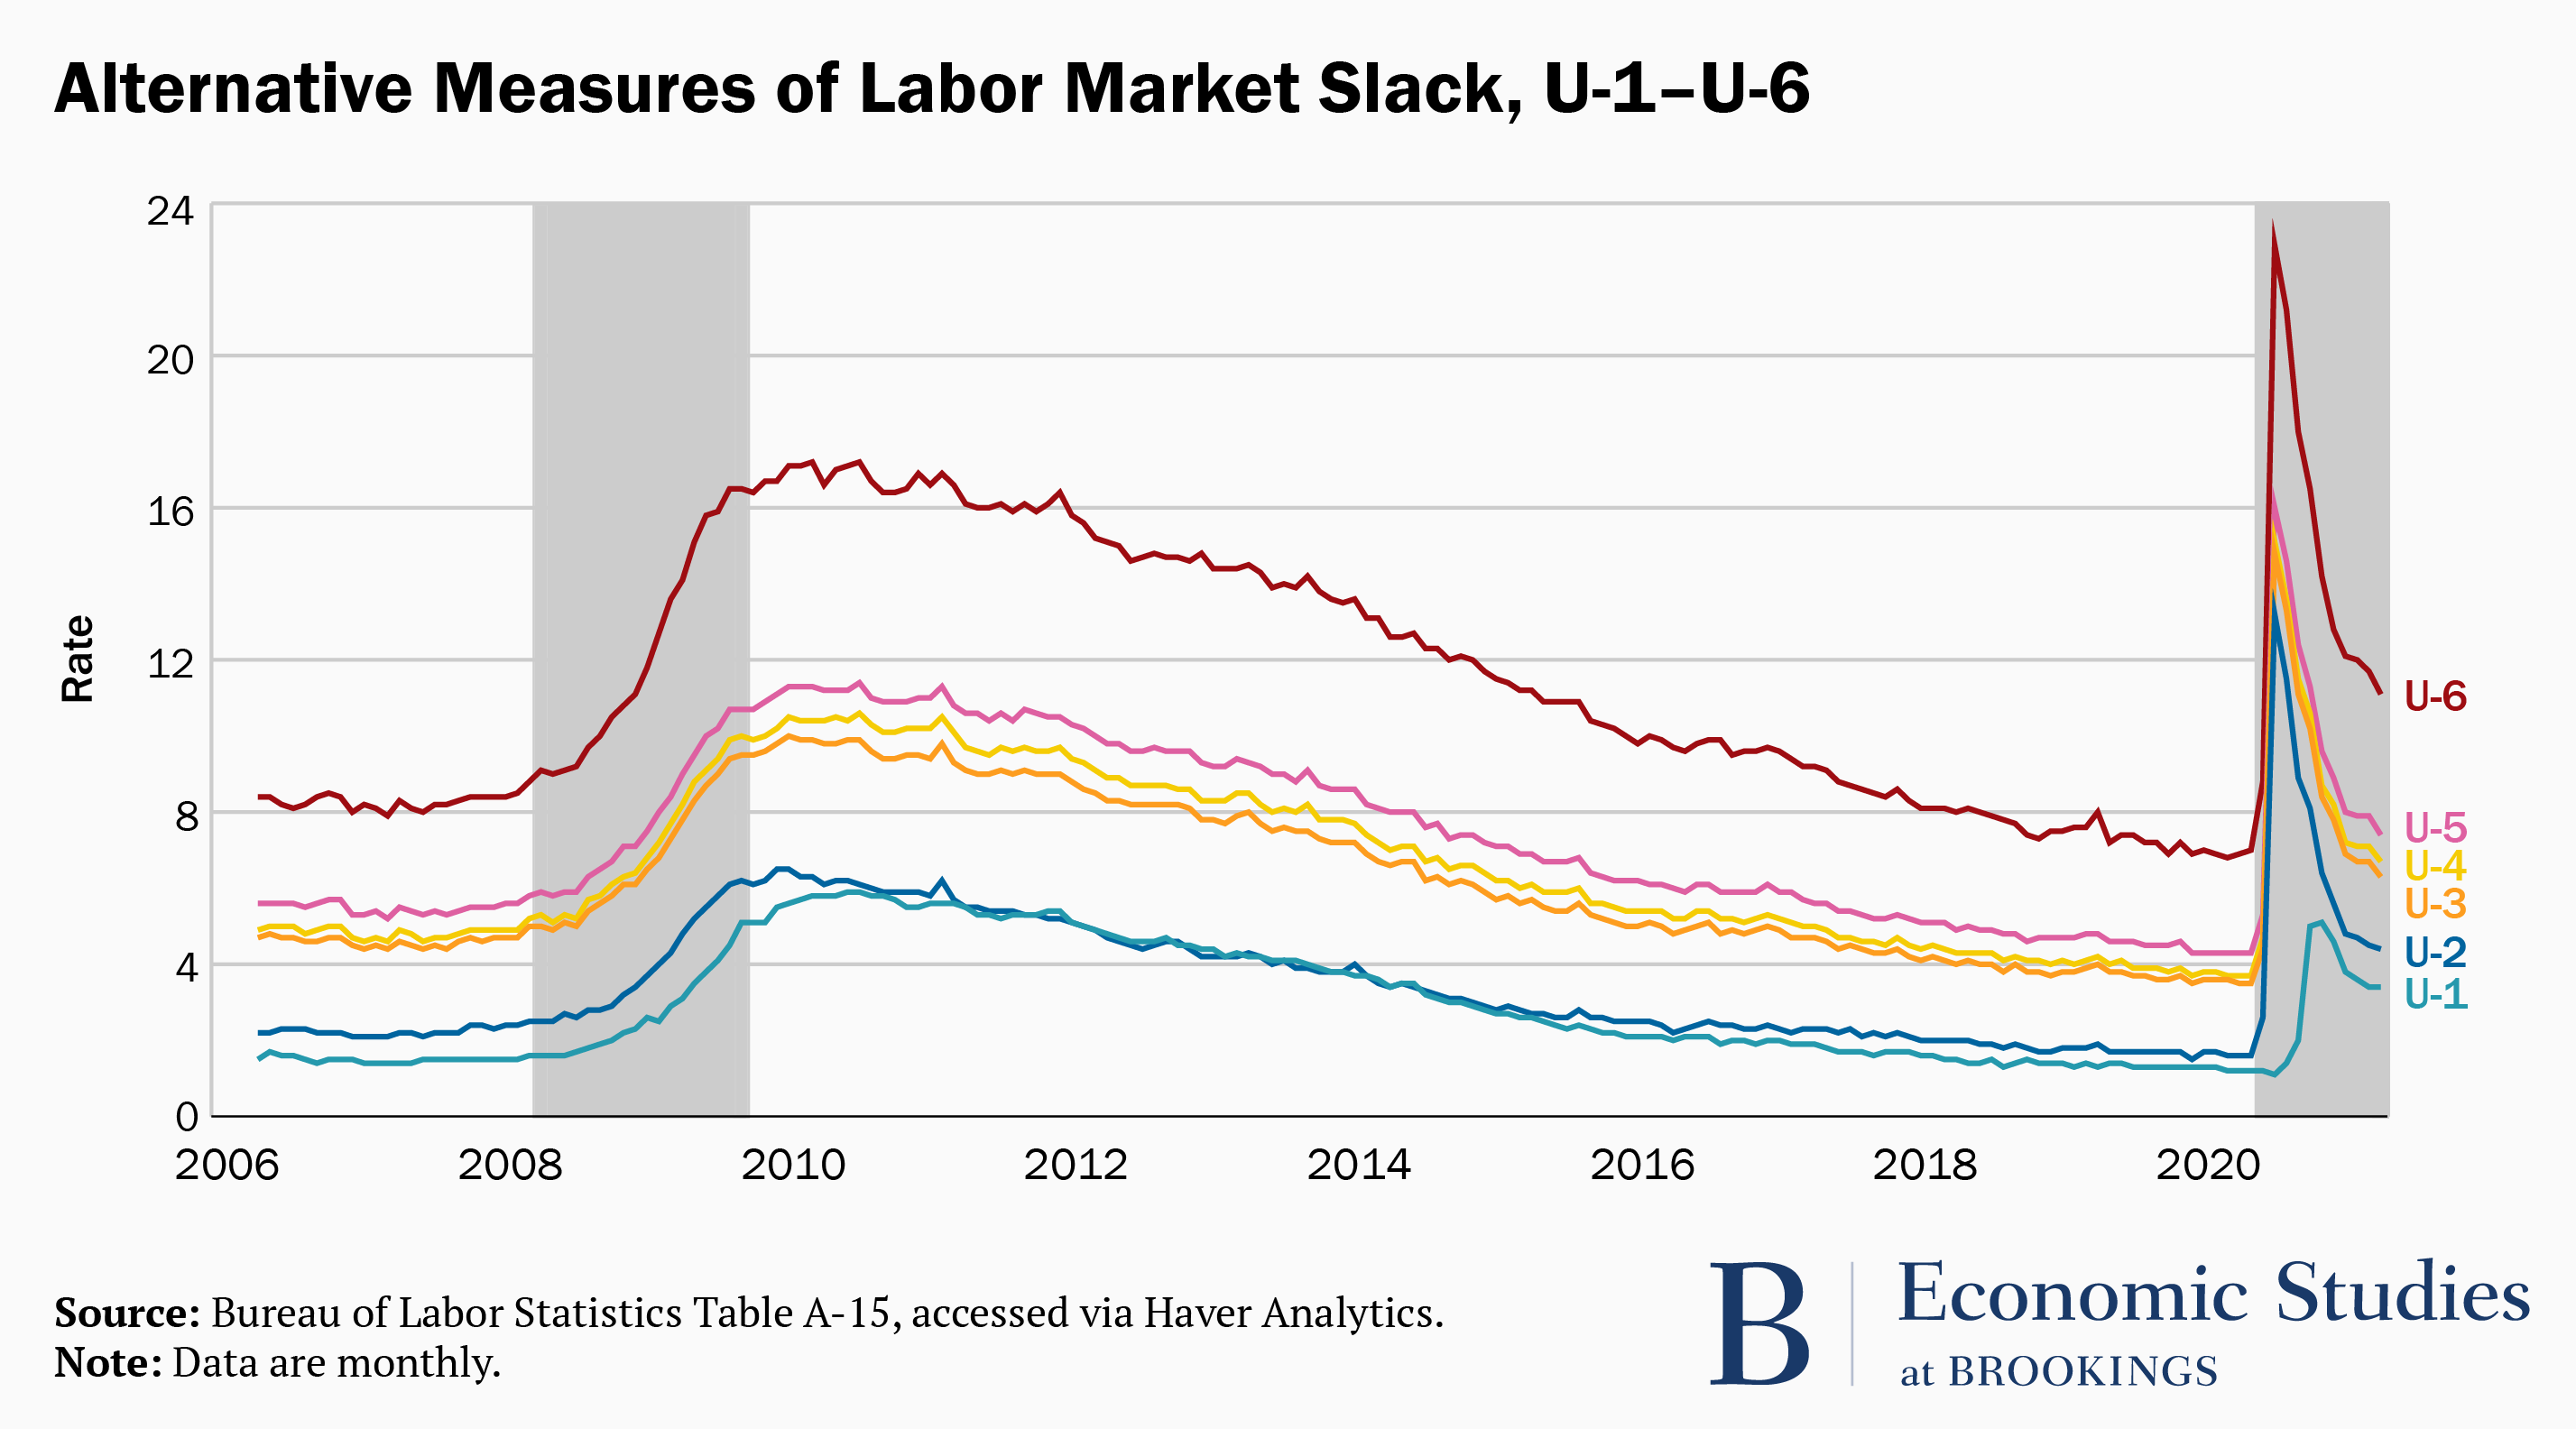
The BLS releases six measures of labor market slack in the monthly jobs report. These include the official unemployment rate (U-3), discussed above, as well as more narrow definitions, called U-1 and U-2, which respectively include only those unemployed at least 15 weeks (the long-term unemployed) or for less than a month (the short-term unemployed). The BLS also publishes broader definitions of slack. The U-6 rate, for instance, counts all those who are technically unemployed plus those are who are working part-time but would prefer full time work, and those “marginally attached to the labor force,” that is, people who say they want either a full-time or part-time job, have not looked for work in the most recent four weeks, but have looked for a job sometime in the past 12 months. When adults classified as “marginally attached” report that they did not recently seek work because they do not believe jobs are available for them, they are classified as “discouraged workers.” The U-4 counts the unemployed and discouraged workers, while U-5 adds in other marginally attached workers. In January, the broadest of these measures, U-6, stood at 11.1 percent, 4.8 percentage points higher than the official unemployment rate.
Given the measurement problems during the pandemic, are there alternatives to the BLS indicators of slack to gauge the health of the labor market?
Some economists have offered their own estimates of labor market slack trying to account for the misclassification and unusual movements in labor force participation during the pandemic. For example, Jason Furman and Wilson Powell III at the Peterson Institute for International Economics calculate what they call the “realistic unemployment rate.” Their realistic unemployment rate was 8.3 percent in January, two percentage points higher than the official unemployment rate. Furman and Powell’s realistic unemployment rate differs from the official in two ways. First, they estimate the number of workers misclassified as being “not at work for other reasons” and count them as unemployed. Second, they try to estimate the excess decline in labor force participation beyond what would be expected given the rise in unemployment, and add those people to the unemployment rate as well. While this estimate is dependent on the specific modeling assumptions, it is nonetheless a useful attempt to reveal the extent to which we underestimate the true disruption to people’s livelihoods if we fail to account for the unusually large drop in labor force participation.
In a recent speech, Fed Chair Jerome Powell outlined his own method for adjusting the unemployment rate to capture the unusual features of the pandemic labor market. First, like Furman and Powell, he adds to the count of the unemployed an estimate of the misclassified workers. In addition, he adds in the number of people who have left the labor force since last February. This measure does not attempt to account for the fact that more people dropped out of the labor force than usual, and it does not account for structural reasons that individuals may have dropped out of the labor force, such as retirement. At the same time, it also isn’t sensitive to the specific modeling assumptions regarding the behavior of the participation rate. His calculations boost the unemployment rate to close to 10 percent in January.
One shortcoming of both these approaches is that they implicitly or explicitly make an assumption about what share of the individuals who are out of the labor force would be unemployed in a more normal recession. In addition, by counting individuals who are out of the labor force as unemployed, these measures would seem to assume that such individuals will act like the unemployed once the economy recovers. But typically, people who are out of the labor force are less likely to become employed than are those who are unemployed. One measure of the unemployment rate that includes individuals out of the labor force but also accounts for this variation in the propensity to return to work is the Hornstein-Kudlyak-Lange non-employment index, which was 9.3 percent in January.
A simpler measure is the employment-to-population-ratio (EPOP), a ratio of the number of people employed to the number of people in the population. The EPOP, which stood at 61.1 percent on the eve of the pandemic, declined by 9.8 percentage points between February and April—the largest decline since the series began in January 1948. Although the EPOP has recovered somewhat, to 57.5 percent, it still stands at its lowest level since the early 1980s, a time when far fewer women were in the labor force. This large drop is direct evidence of the unprecedented toll that the pandemic has taken on the labor market and people’s livelihoods.
What are “initial claims” for unemployment insurance?
When people first file for unemployment insurance (UI), they are counted as an “initial claim.” So when unemployment increases, initial claims tend to rise. Because initial claims are reported weekly, they are often used as an early indicator of the overall unemployment rate.
What is the relationship between initial claims and the unemployment rate — and why might it be different now?
The number of people receiving UI and the number counted as unemployed do tend to move in the same direction, but there is no formal link between the two. The only criteria for being counted as unemployed (and hence included in the unemployment rate) are that you are without a job and that you have actively searched for work or are on temporary layoff. You don’t need to be collecting unemployment insurance to be counted as unemployed. And some people are eligible to collect partial unemployment insurance benefits if they are working but have been assigned a schedule that is far below their usual weekly hours.
Many people who become unemployed do not apply for UI benefits, either because they are not eligible or because they choose not to apply. So initial claims typically understate the number of people becoming unemployed in a given week. That said, there are people who file an initial claim and are not counted as unemployed in the CPS. This could happen if a person doesn’t meet the CPS criteria for being unemployed—for instance, if they file for UI because their work schedule was reduced, or if the person has a very short spell of unemployment which is not captured in the CPS (for example, a person who becomes unemployed and finds a job in between survey reference weeks).
Furthermore, many people who are unemployed and do file an initial claim do not end up receiving unemployment insurance benefits, either because they are not covered by the program, because they have not accumulated enough working hours to be eligible for benefits, or because they don’t satisfy the job search requirements. In February 2020, before the pandemic, the number of people unemployed was about 5.8 million while the number of people receiving UI benefits averaged only about 1.7 million.
What is the payroll survey? And why is it likely to be less useful than usual?
The payroll (or establishment) survey is a survey of 145,000 businesses—employing about one third of all workers on nonfarm payrolls. The payroll survey tends to have difficulty when the economy is at a turning point, as is the case now. To create the sample to be surveyed, the BLS picks firms from the universe of firms that have unemployment insurance tax accounts. However, new firms do not enter the BLS sample universe right away, and the BLS can have difficulty distinguishing non-response from a firm closure in real time. Since the net contribution of jobs created at new firms and jobs destroyed at closing firms is typically small, the BLS assumes that nonresponding firms have the same change in employment as occurred at firms that responded. It then uses a model, called the net birth-death model, to forecast the residual between that imputation and the actual data. This model tends to overestimate employment growth when the economy is weakening and underestimate it when the economy is improving. And while the model error is typically small, it can, on occasion, be large.
We know about these forecast errors because the BLS revises the data based on more complete information. In most years the benchmark is small, with the level of employment revising up or down by less than 0.2 percentage points. However, strikingly, when the establishment survey data for March 2009—the depths of the Great Recession—were benchmarked, the level of payroll employment was revised down by over 900,000 jobs, or 0.7 percentage points—meaning that employers had shed 75,000 more jobs each month between April 2008 and March 2009 than previously estimated.
If, as a result of the pandemic, an unusually large number of firms are closing and few are opening, it seems possible that even the dramatic decline in employment that we are likely to see will underestimate the true extent of job loss.
Why might the historical link between unemployment and poverty be a misleading way to look at today’s numbers?
When people become unemployed, they lose an important (and sometimes their only) source of income and are at risk of falling into poverty. Of course, the more generous unemployment insurance is, the less likely it is for someone who loses a job to become poor. But unemployment insurance has typically replaced only about 40 percent of lost wages, on average, over the past 20 years, with a lot of variation in generosity across the states.
The federal response to the pandemic changed that. The CARES Act, for instance, added $600 a week to weekly unemployment insurance benefits through the end of July 2020, preventing many families from falling into poverty, and the December extension provided for an additional $300. And, of course, Congress provided two rounds of one-time payments for most families—$1,200 per adult and $500 per dependent child in the spring of 2020 and another $600 per individual in December, with payments phasing out for higher earners. Estimates suggest that about 13 million people were prevented from falling into poverty by these efforts.
Authors

-
Acknowledgements and disclosures
The author thanks Francisca Alba for research assistance and Becca Portman for graphic design.


Commentary
What does the unemployment rate measure?
February 18, 2021